
Abstract
BACKGROUND AND PURPOSE: Parkinson disease is a prevalent disease, with olfactory dysfunction recognized as an early nonmotor manifestation. It is sometimes difficult to differentiate Parkinson disease from atypical parkinsonism using conventional MR imaging and motor symptoms. It is also known that olfactory loss occurs to a lesser extent or is absent in atypical parkinsonism. To the best of our knowledge, no study has examined olfactory bulb changes to differentiate Parkinson disease from atypical parkinsonism, even in an early diagnosis, and its association with conventional MR imaging findings. Hence, we aimed to assess the utility of olfactory bulb measurements in differentiating Parkinson disease from atypical parkinsonism even in the early stage.
MATERIALS AND METHODS: In this retrospective study, we enrolled 108 patients with Parkinson disease, 13 with corticobasal syndrome, 15 with multiple system atrophy, and 17 with progressive supranuclear palsy who developed parkinsonism. Thirty-nine age-matched healthy subjects served as controls. All subjects underwent conventional MR imaging and 3D FIESTA for olfactory bulb measurements using manual ROI quantification of the cross-sectional olfactory bulb area using the coronal plane. Bilateral olfactory bulb measurements were averaged. For group comparisons, we used the Welch t test, and we assessed diagnostic accuracy using receiver operating characteristic analysis.
RESULTS: Patients with Parkinson disease had a mean olfactory bulb area of 4.2 (SD, 1.0 mm2), significantly smaller than in age-matched healthy subjects (6.6 [SD, 1.7 mm2], P < .001), and those with corticobasal syndrome (5.4 [SD, 1.2 mm2], P < .001), multiple system atrophy (6.5 [SD, 1.2 mm2], P < .001), and progressive supranuclear palsy (5.4 [SD, 1.2 mm2], P < .001). The receiver operating characteristic analysis for the olfactory bulb area measurements showed good diagnostic performance in differentiating Parkinson disease from atypical parkinsonism, with an area under the curve of 0.87, an optimal cutoff value of 5.1 mm2, and a false-positive rate of 18%. When we compared within 2 years of symptom onset, the olfactory bulb in Parkinson disease (4.2 [SD, 1.1 mm2]) remained significantly smaller than in atypical parkinsonism (versus corticobasal syndrome (6.1 [SD, 0.7 mm2]), P < .001; multiple system atrophy (6.3 [SD, 1.4 mm2]), P < .001; and progressive supranuclear palsy (5.2 [1.3 mm2], P = .003, respectively).
CONCLUSIONS: 3D FIESTA-based olfactory bulb measurement holds promise for distinguishing Parkinson disease from atypical parkinsonism, especially in the early stage.
ABBREVIATIONS:
- AUC
- area under the curve
- CBS
- corticobasal syndrome
- DIP
- drug-induced parkinsonism
- FIESTA
- fast imaging employing steady-state acquisition
- ET
- essential tremor
- HS
- healthy subjects
- MCP
- middle cerebellar peduncle
- MSA
- multiple system atrophy
- OB
- olfactory bulb
- PD
- Parkinson disease
- PSP
- progressive supranuclear palsy
- ROC
- receiver operating characteristic
- SCP
- superior cerebellar peduncle
- VP
- vascular parkinsonism
SUMMARY SECTION
PREVIOUS LITERATURE:
Patients with Parkinson disease commonly exhibit olfactory dysfunction from early stages, making olfactory nerve imaging a focus for early and differential diagnosis. Olfactory disturbances aid in distinguishing Parkinson disease from atypical parkinsonism. Recent imaging studies highlighted the potential of olfactory bulb measurements for this differentiation, however, these studies were limited by small sample sizes, a narrow disease spectrum, lack of comparison with established MR imaging findings, and inadequate assessment of early-stage disease.
KEY FINDINGS:
This study demonstrated that, using 3D-FIESTA, the olfactory bulb in Parkinson disease was notably smaller than in atypical parkinsonism, showing strong diagnostic accuracy (AUC: 0.87). An optimal cutoff of 5.1 mm2 yielded 81% true-positive and 18% false-positive rates. This accuracy extended to early-stage within two years of onset.
KNOWLEDGE ADVANCEMENT:
Our findings advance knowledge by demonstrating that 3D-FIESTA-based measurement of olfactory bulb area can be an imaging biomarker in the differentiation of suspected parkinsonism. This simple, noncomplex approach could become a valuable, routine diagnostic tool in brain MR imaging studies for suspected parkinsonism cases.
Parkinson disease (PD), a neurodegenerative disorder, chiefly impacts the motor system, manifesting with symptoms like tremor, rigidity, and bradykinesia. However, it is also notable for its nonmotor symptoms.1 Olfactory dysfunction, for instance, is a common characteristic in PD, affecting roughly 70%–90% of patients.2 Postmortem studies have confirmed the presence of Lewy bodies in the olfactory bulb (OB), supporting this observation.3 This symptom is not tied to the severity or duration of the disease and often emerges before the onset of motor symptoms, marking it as a premotor indicator of PD.4
Atypical parkinsonism, including progressive supranuclear palsy (PSP), multiple system atrophy (MSA), corticobasal syndrome (CBS), essential tremor (ET), vascular parkinsonism (VP), and drug-induced parkinsonism (DIP), is crucial in the differential diagnosis of parkinsonism; this significance stems from the markedly different treatments and prognoses of PD and atypical parkinsonism. Early diagnosis and intervention are crucial for patient management, and while diverse clinical symptoms and imaging differences can aid in distinguishing these diseases, it frequently proves challenging in practical scenarios.5 Recently, the efficacy of olfactory tests in distinguishing PD from atypical parkinsonism has been highlighted, particularly in the context of early diagnosis. As mentioned above, PD leads to olfactory dysfunction, while atypical parkinsonism typically results in minimal or no olfactory issues.6 Moreover, Goldstein et al7 recommended olfactory tests to differentiate PD from MSA. Recognizing their diagnostic value, the American Academy of Neurology's Quality Standards Committee advises using olfactory assessments to differentiate PD from diseases like PSP and CBS.8 However, while olfactory tests are informative, they are not entirely conclusive in instances of coexisting rhinitis, a prevalent condition. Moreover, not every PD case results in dysosmia, so the establishment of objective biomarkers via diagnostic imaging is sought.
MR imaging is commonly used to gauge the OB volume, shedding light on olfactory functions. Several MR imaging studies have compared OB volumes between patients with PD and healthy subjects (HS). Generally, these studies found that patients with PD have smaller OB sizes than their healthy counterparts.9⇓–11 While using OB measurements to distinguish PD from atypical parkinsonism remains a challenge, there are existing reports on the matter. Two studies suggest that OB volume measurements can aid in differentiating PD from atypical parkinsonism. However, these studies had some limitations. One involved a small sample of 13 PD cases, 11 MSA cases, 5 CBS cases, and 5 PSP cases.12 The other included a slightly larger group, with 40 PD, 20 PSP, 10 MSA, 10 VP, and 30 HS, yet it omitted a comparison with CBS, a key differential diagnosis.13 Moreover, neither study aligned with the findings from conventional MR imaging. Additionally, no studies have compared OB volumes across conditions like degenerative parkinsonism, ET, VP, and DIP, which are all relevant in PD diagnosis.
Advanced MR imaging techniques offer radiologists detailed views of the cranial nerves, especially within the cisternal segments. Notably, balanced steady-state free methods like fast imaging employing steady-state acquisition (FIESTA) provide intrinsic flow suppression and a high SNR.14 This result improves visualization of intricate structures such as the olfactory nerves in the anterior basal cistern compared with fast spin-echo T1WI and T2WI.
Given the evidence, we posit that measuring the size of the OB can aid in distinguishing PD and atypical parkinsonism, particularly in the early phases of the disease. This study aimed to assess basic morphologic attributes of the OB using 3D FIESTA and validate their efficacy in differentiating PD from atypical parkinsonism. Additionally, we compared changes in the OB size with prior conventional MR imaging findings for these conditions to evaluate their diagnostic precision.
MATERIALS AND METHODS
Approval
This study protocol was approved by the institutional review board at the University of Occupational and Environmental Health School of Medicine (Kitakyushu, Fukuoka, Japan, UOEHCRB22-147) and was conducted in accordance with the Declaration of Helsinki. Imaging and clinical data were retrospectively acquired from 180 patients and 52 HS. The institutional review board granted permission to use the retrospective data in the study without individual informed consent.
Subjects
All subjects presenting with parkinsonism underwent MR imaging at the institution to exclude atypical parkinsonism, and FIESTA was included in the routine examination following a previous report indicating that these patients may experience olfactory dysfunction and OB atrophy.11 From an MR imaging database from February 2019 to March 2023, two hundred eighty-five consecutive subjects with suspected parkinsonism who underwent MR imaging were selected. Of these, the conditions of 108 were classified as PD; 72, as atypical parkinsonism; 40, as other neurologic conditions; 13, as a difficult-to-confirm diagnosis; and 52, as HS. Atypical parkinsonism included CBS in 13 cases, MSA in 15 cases, PSP in 17 cases, VP in 7 cases, ET in 13 cases, and DIP in 7 cases. Conclusive clinical diagnoses were reached collaboratively by 2 experienced neurologists, both authors of this article, with 32 and 25 years of experience in movement disorders, respectively.
According to each proposed diagnostic criteri,15⇓⇓⇓⇓⇓–21 the final clinical diagnosis was determined using data available at the time of presentation, supplemented by some serial clinical data and MR imaging results. Patients with PD were classified into 3 groups based on the presence or absence of subjective symptoms of olfactory impairment: those with dysosmia (n = 11), those without dysosmia (n = 40), and those with unknown status due to lack of data (n = 57). Patients with MSA were classified as having MSA-P in 12 cases and MSA-C in 3 cases. The exclusion criteria included patients with no diagnosis or diagnosed with other neurologic conditions and those with unsatisfactory images due to artifacts; a total of 53 cases with no diagnosis or those diagnosed with other neurologic conditions were excluded. No subjects were excluded due to image-quality degradation caused by artifacts. Of the 52 HS, 39 consecutive individuals 60 years or age or older were chosen as HS (mean age, 73.1 years; range, 62–85 years). Additionally, these HS were confirmed as age-matched to the PD group using a t test showing no significant age difference (mean age for PD: 72.0 years; range, 44–88 years; P = .49). The indications for MR imaging in HS included dysosmia, tremor, and gait disturbance, but it was determined during the subsequent examination that there were no abnormalities. The HS had no history of neurologic disease, malignancy, or brain surgery and had normal brain MR imaging results; determination of HS with normal MR imaging findings was based on the clinical report. None of the subjects were infected with coronavirus 2019 (COVID-19) before the MR imaging examination. The details of the clinical characteristics of subjects are shown in the Online Supplemental Data.
Image Acquisition
All studies were performed on a 3T MR imaging system (Signa Premier 3T; GE Healthcare) using a dedicated 48-channel phased-array coil (USA Instruments). All patients and HS underwent brain MR imaging according to our standard protocol, including T1WI, T2WI, T2*WI, and FLAIR imaging. Only T1WI was obtained using a 3D acquisition. The imaging parameters of 3D FIESTA included the following: coronal planes covering the brain: TE, 2.2 ms; TR, 4.8 ms; flip angle, 45°; bandwidth per pixel, ± 62.5 Hz; field of view, 16 × 16 cm; reconstruction matrices, 512 × 512; section thickness, 1.0 mm; spatial resolution, 0.7 × 0.6 × 1.0 mm; and imaging time, 1 minute 58 seconds. All FIESTA images were obtained in the coronal section, perpendicular to the long axis of the olfactory nerve. There were no differences in scanner or scan parameters between subjects or subcohorts.
Brain Volumetric Analysis
All 3D T1WI acquired with spoiled gradient-recalled images was processed using FreeSurfer, Version 6.0 software (http://surfer.nmr.mgh.harvard.edu) with HCP Pipeline Scripts, Version 4.3.0 (https://github.com/Washington-University/HCPpipelines) and inspected by the study team (I.U. and Y.Y.), resulting in the extraction of the following parameters: brain parenchymal fraction, total gray matter volume, estimated total intracranial volume, and hippocampus volume. These measurements were used to assess structural changes in the brain.
Image Evaluations
Two neuroradiologists, each with 14 and 15 years of clinical experience, assessed the measurement of OB areas using FIESTA and evaluated conventional MR imaging.
Measurement of the OB.
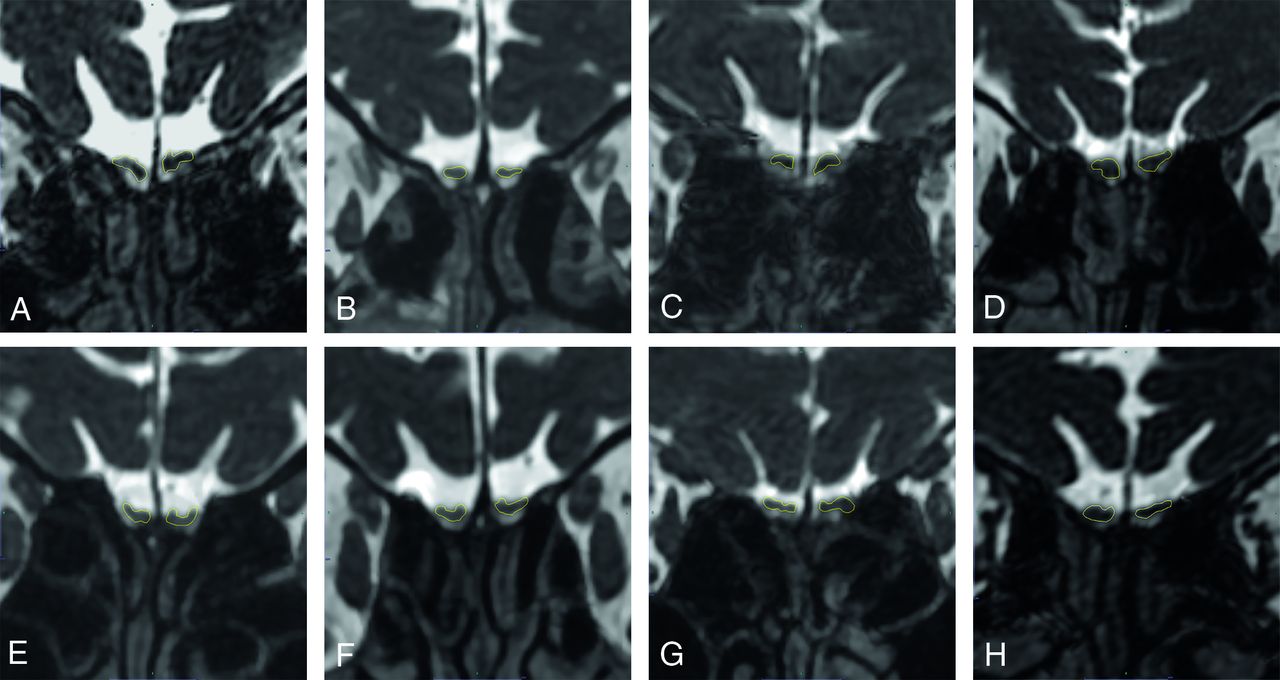
Two neuroradiologists, who were unaware of the clinical information, independently reviewed the entire length of the olfactory nerve using coronal FIESTA imaging, from the level of the cribriform plate to the brain (Fig 1). They selected the section where the olfactory nerve was most prominently depicted on visual assessment, specifically the section identified as the OB. They used a dedicated PACS viewer to set manual ROIs on the OBs and measured their areas. The average of these measurements was the “mean OB area,” then used as the individual data for each patient.

Representative cases of measurement of olfactory bulbs for HS (A), PD (B), CBS (C), MSA (D), PSP (E), VP (F), ET (G), and DIP (H). A, HS: A 75-year-old woman, right (Rt): 7.5 mm2, left (Lt): 6.8 mm2, mean: 7.2 mm2. B, PD: A 69-year-old woman, Rt: 3.7 mm2, Lt: 3.3 mm2, mean: 3.5 mm2. C, CBS: A 77-year-old woman, Rt: 4.7 mm2, Lt: 6.7 mm2, mean: 5.7 mm2. D, MSA: A 68-year-old woman, Rt: 7.2 mm2, Lt: 6.7 mm2, mean: 7.0 mm2. E, PSP: A 77-year-old woman, Rt: 5.0 mm2, Lt: 5.6 mm2, mean: 5.3 mm2. F, VP: A 68-year-old woman, Rt: 4.6 mm2, Lt: 5.7 mm2, mean: 5.2 mm2. G, ET: A 47-year old man, Rt: 6.7 mm2, Lt: 7.7 mm2, mean: 7.2 mm2. H, DIP: A 77-year-old man, Rt: 6.3 mm2, Lt: 5.7 mm2, mean: 6.0 mm2. Notably, the OB area in the patient with PD (B) is smaller compared with both HS (A) and those with atypical parkinsonism (C–H).
Additionally, we investigated the correlation between OB area and OB volume. Using FIESTA of the coronal sections, we identified the OB as follows: The end of the OB or the beginning of the olfactory tract was clearly discerned as a change in diameter, and the boundaries of the OBs were determined by the surrounding CSF and the anterior cribriform plate.11 The volume of the OB was measured section-by-section according to the previous report,11 and the total volume of all slices was used as the volume of the entire OB to evaluate the correlation with the maximum cross-sectional area. To correlate with the mean OB area, we used the average value of the left and right sides as the individual’s data.
Evaluation of Conventional MR Imaging.
Next, for the conventional MRIs (T1WI, T2WI, T2*WI, and FLAIR images), the 2 neuroradiologists who were blinded to clinical information independently assessed those images to determine whether there were characteristic imaging findings for CBS, MSA, and PSP, as described in previous reports.5,22,23 This evaluation was conducted separately from the measurement of OB using FIESTA as mentioned above. The presence of typical findings for CBS (asymmetric cerebral/cerebral peduncle atrophy and corpus callosum atrophy), for MSA (putaminal atrophy/iron deposition, pontine atrophy/hot cross bun sign, and middle cerebellar peduncle [MCP] atrophy/abnormal signal intensity), and for PSP (midbrain/superior cerebellar peduncle [SCP] atrophy and cerebellar atrophy) was assessed.
Statistical Analysis
First, we investigated the relationship between the OB area and disease duration in PD, the relationship between OB area and aging in HS, and the correlation between OB area and volume using the Spearman rank correlation coefficient. Next, we conducted major comparisons among groups using ANOVA first and intergroup comparisons for OB measurements using the Welch t test, and the results were displayed using boxplots. The results were then compared to OB area of atypical parkinsonism. Furthermore, we conducted intergroup comparisons to determine whether differences in the OB area occurred in cases with symptom onset within 2 years. Finally, to demonstrate the utility of OB measurements in discriminating PD and atypical parkinsonism, we used cutoff values in a receiver operating characteristic (ROC) curve analysis, which were determined using the Youden index.
An ANCOVA was conducted to examine the impact of the diagnosis on the mean OB area, while controlling for age, total intracranial volume, gray matter volume, the brain parenchymal fraction, and hippocampal volume.
Interobserver reproducibility for OB measurements was assessed by intraclass correlation coefficients; intraclass correlation coefficient 0–0.2 indicates poor agreement; 0.3–0.4, fair agreement; 0.5–0.6, moderate agreement; 0.7–0.8, strong agreement; and >0.8, excellent agreement.24 Interobserver agreement for conventional MR imaging assessment was calculated as a weighted κ value. The strength of agreement was considered fair for κ values of 0.21–0.40, moderate for κ values of 0.41–0.60, good for κ values of 0.61–0.80, and excellent for κ values of ≥0.81.
All statistical analyses were performed with BellCurve for Excel (Social Survey Research Information Co). A P value < .05 was considered statistically significant.
RESULTS
Interobserver Reproducibility for OB Measurements
Interobserver reproducibility of OB measurements by the 2 neuroradiologists demonstrated 0.88 (95% CI, 0.86–0.90), which corresponded with excellent agreement.
Interobserver Agreements for Conventional MR Imaging Assessment
The κ values for interobserver agreements for conventional MR imaging assessment between the 2 neuroradiologists were 0.79 for asymmetric cerebral/cerebral peduncle atrophy, 0.81 for putaminal atrophy/iron deposition, 0.74 for pontine atrophy/hot cross bun sign, 0.83 for MCP atrophy/abnormal signal intensity, 0.78 for mid-brain/SCP atrophy, 0.76 for corpus callosum atrophy, and 0.80 for cerebellar atrophy, respectively; these values corresponded with good-to-excellent agreement.
Results of Correlation Analyses
There was no significant correlation between the duration of disease and the OB area (the correlation coefficient was −0.04, with P = .68). Also, in HS, it was demonstrated that the OB area decreases with age (the correlation coefficient was −0.32, with P = .019, Online Supplemental Data). The correlation analysis revealed a significant correlation between OB area and volume (the correlation coefficient = 0.94, with P < .001, Online Supplemental Data).
Comparison of Mean Area of OB among PD, Atypical Parkinsonism, and Age-Matched HS
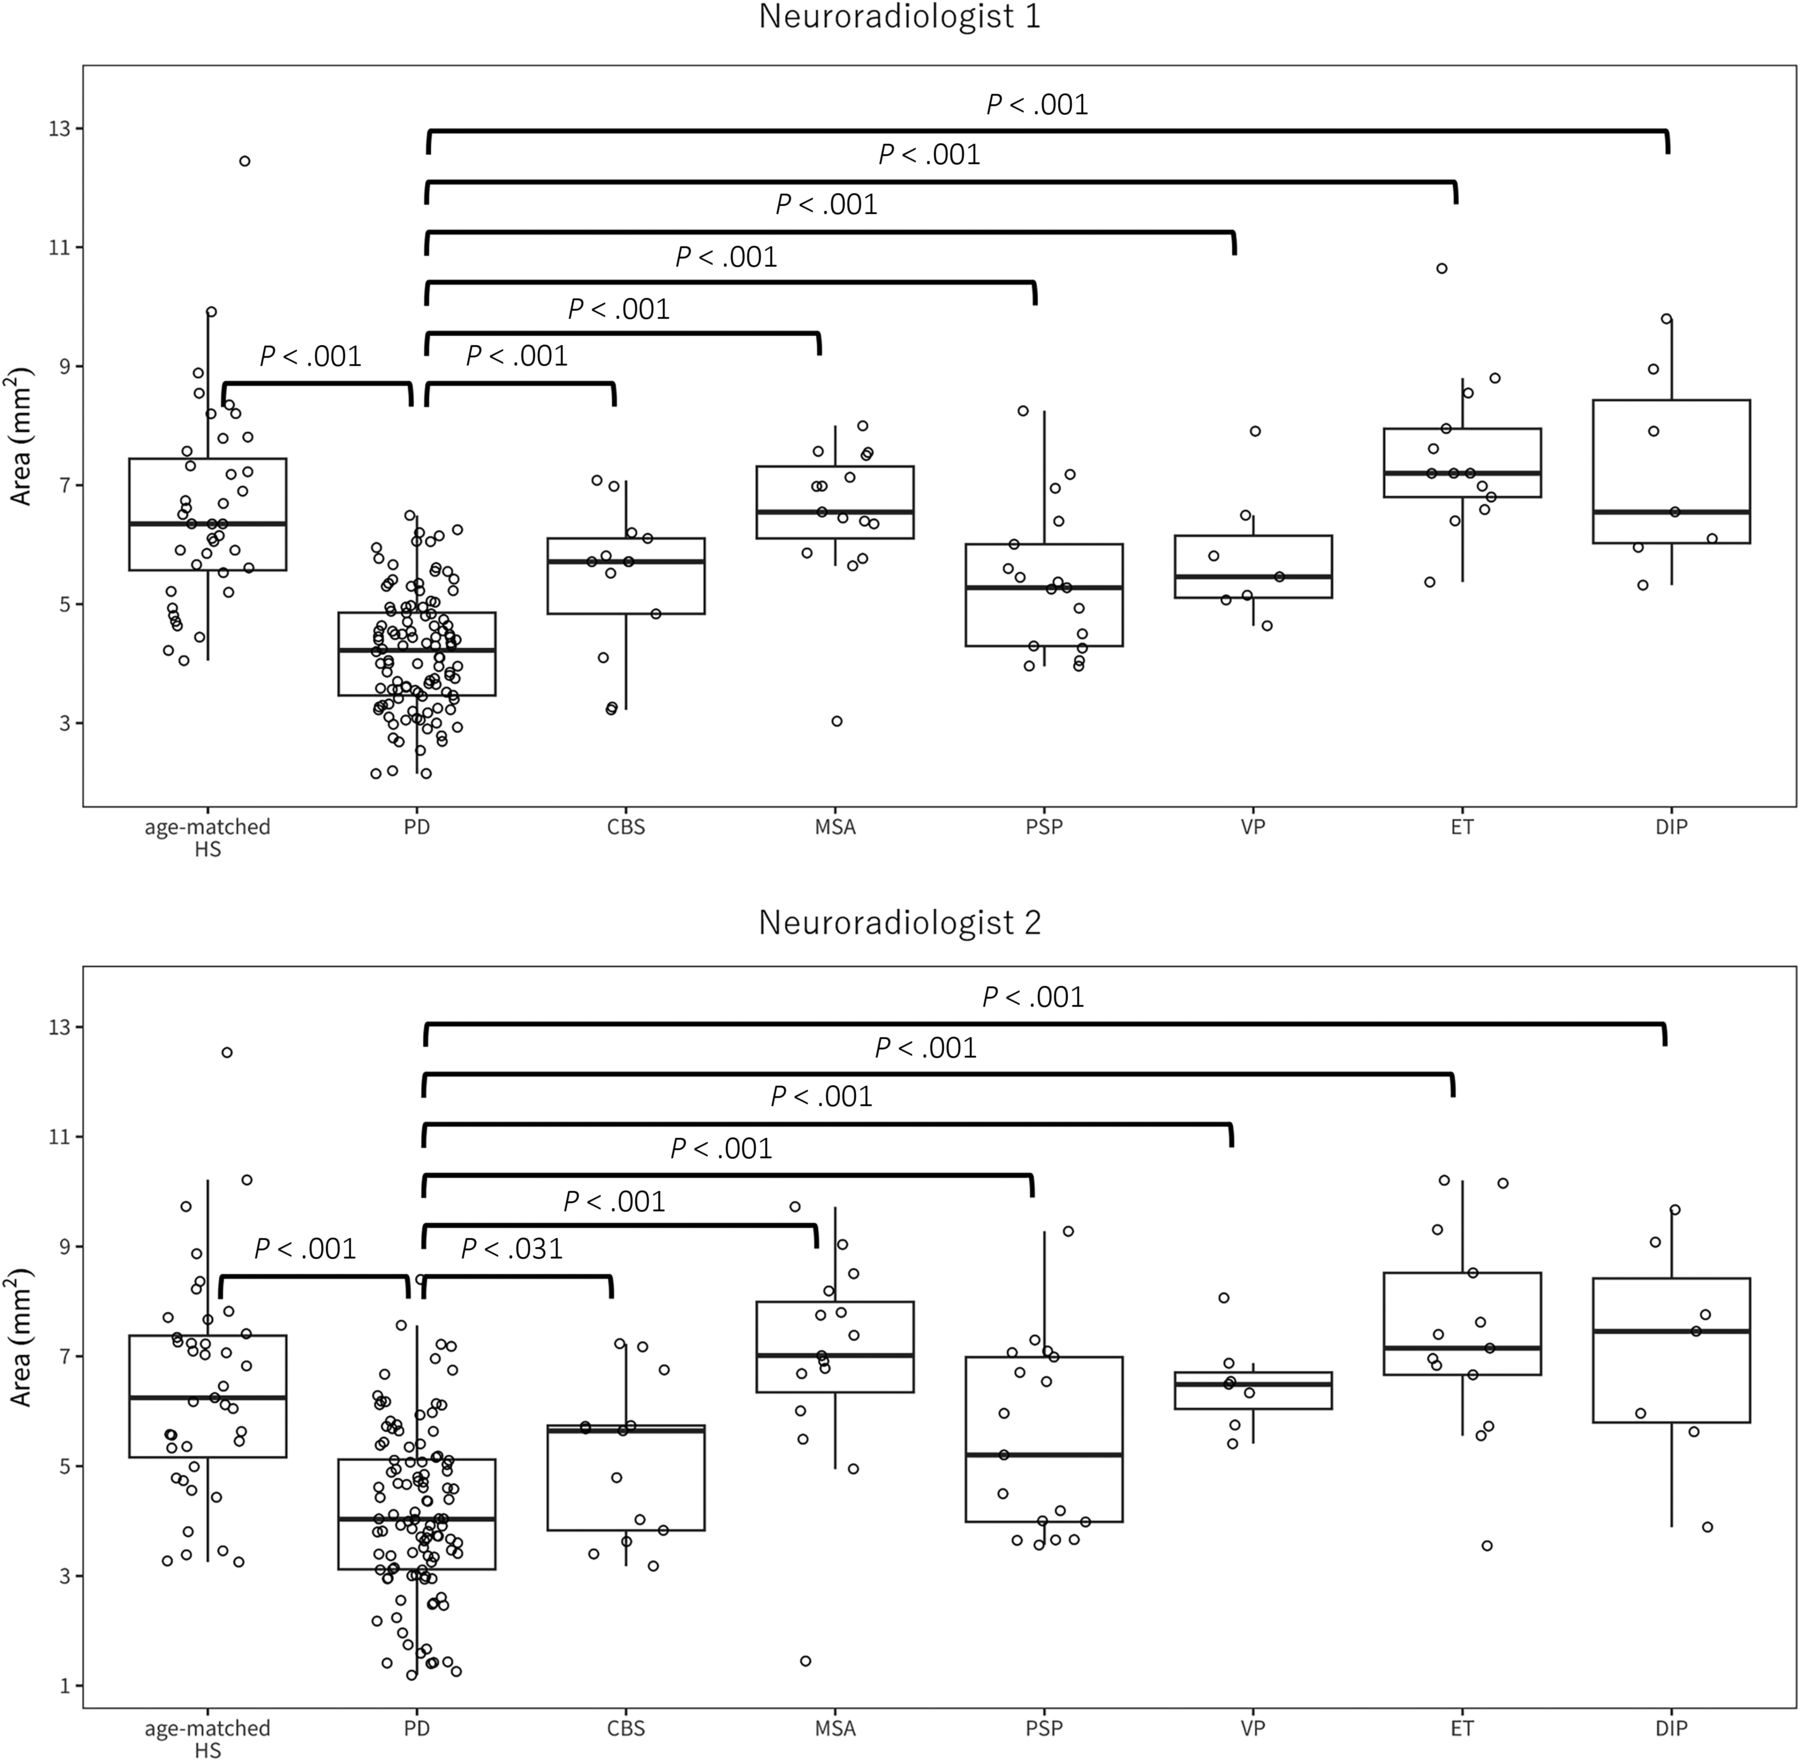
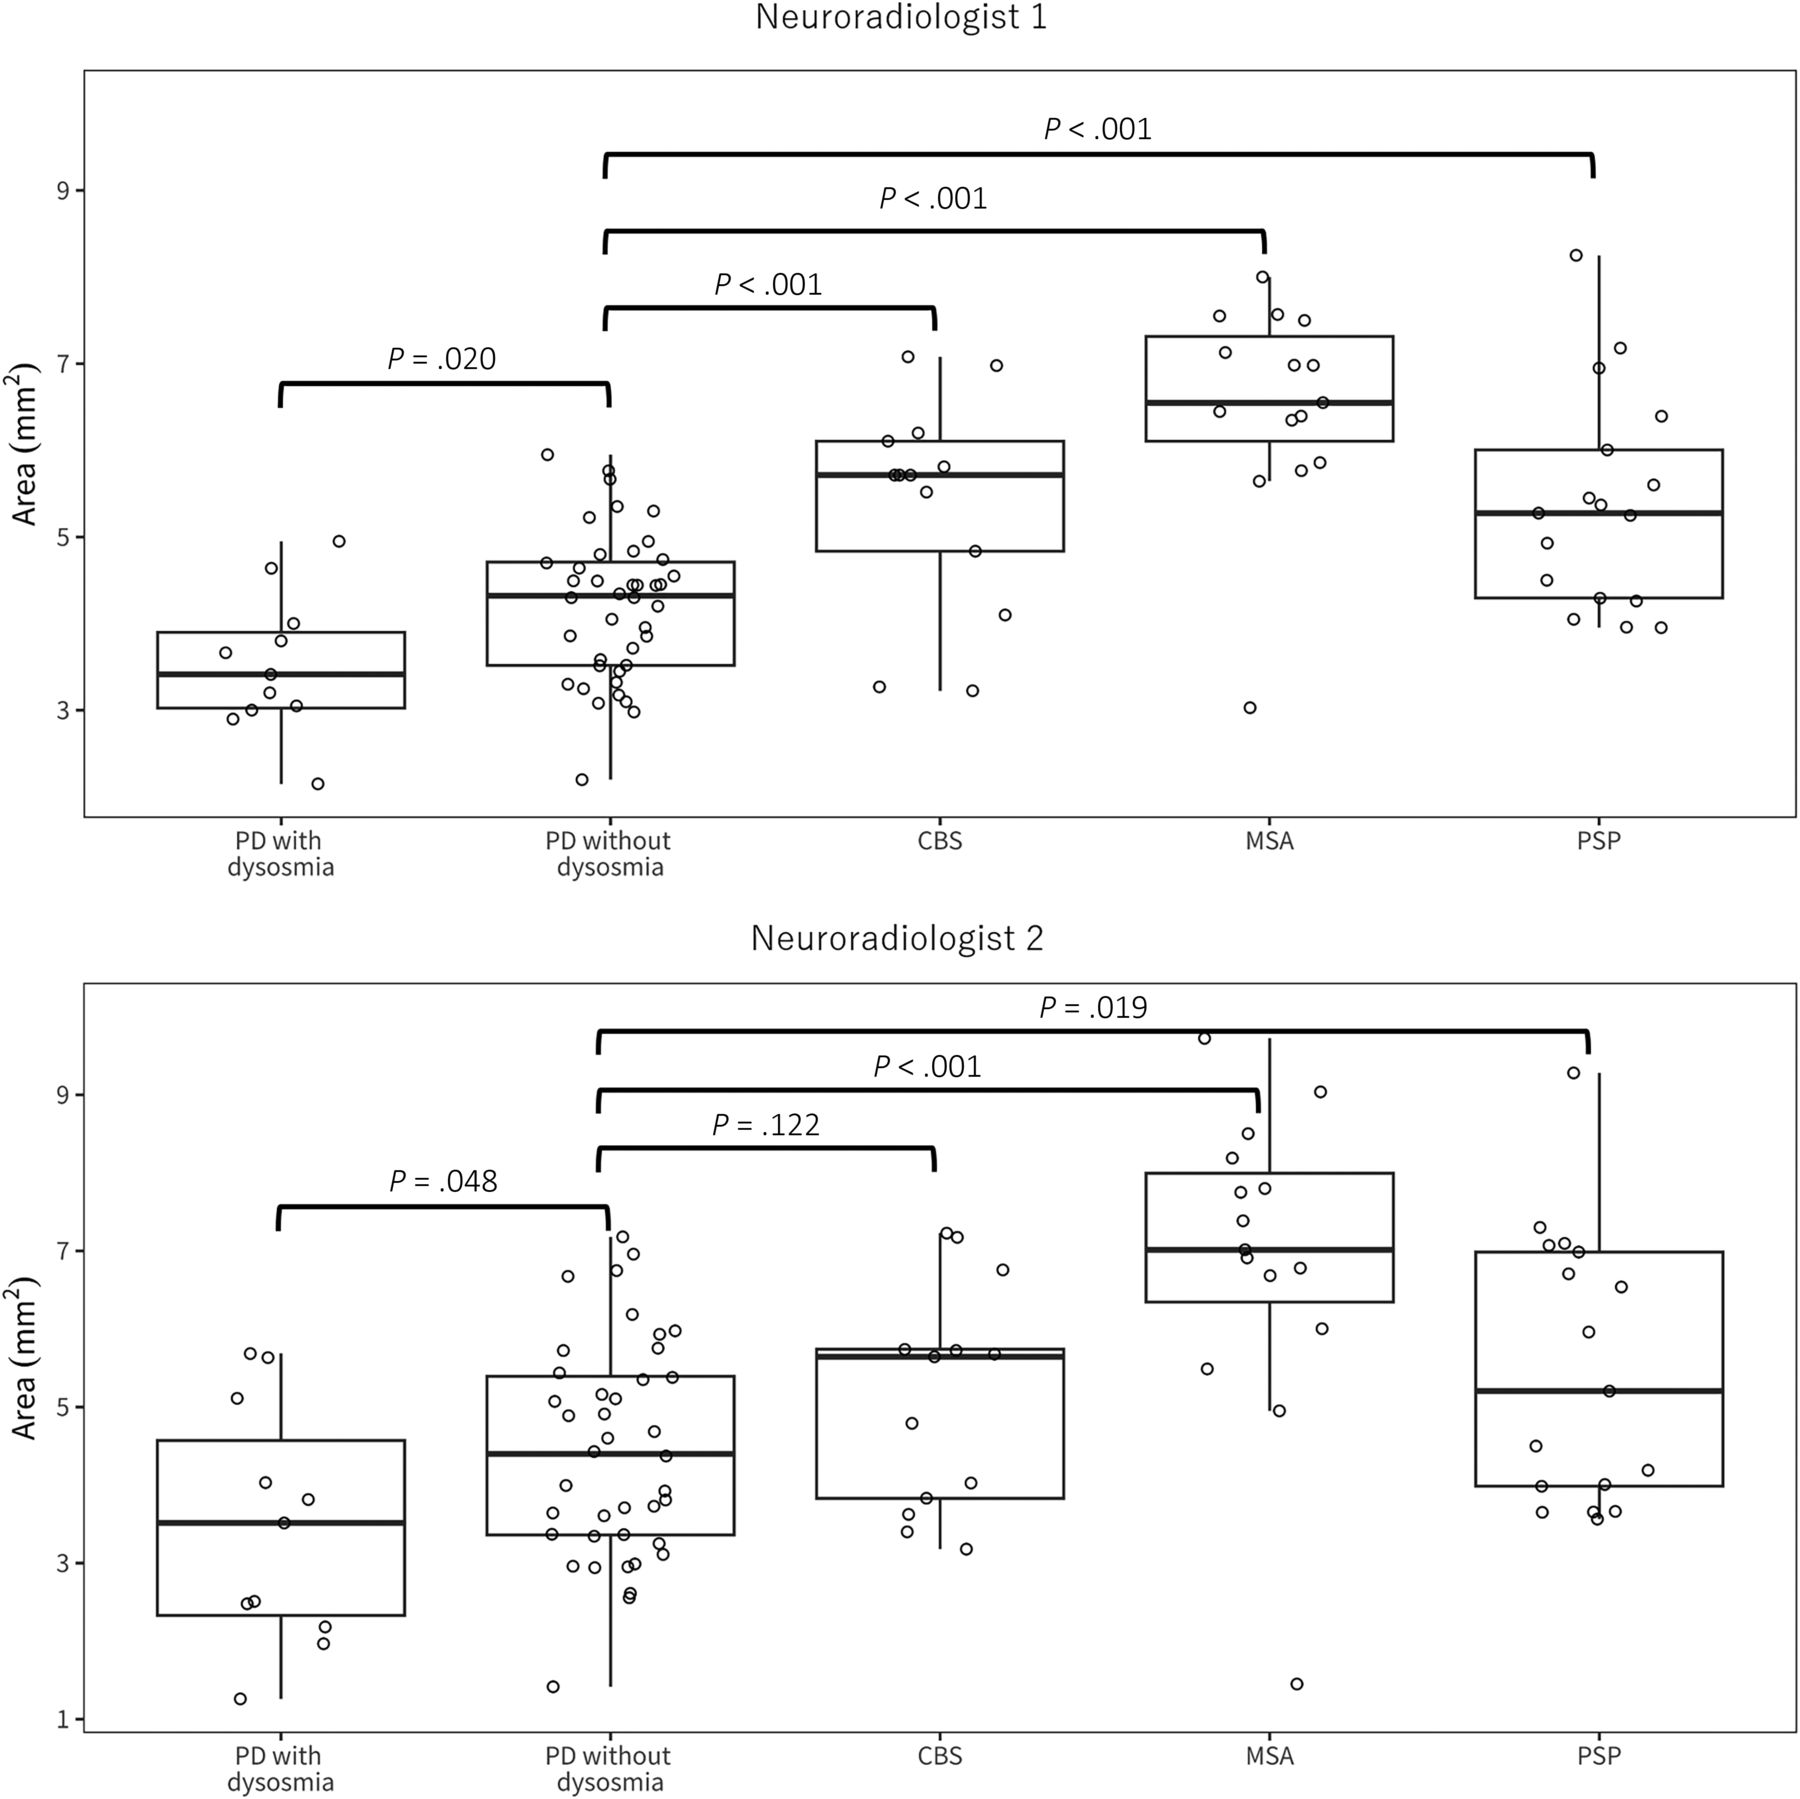
The results of ANOVA revealed that for neuroradiologist 1, the F value was 29.1 with P < .001, and for neuroradiologist 2, the F value was 15.8 with P < .001. For neuroradiologist 1, the mean OB area in PD was significantly smaller compared with that in age-matched HS (mean area, 4.19 [SD, 0.99] versus 6.59 [SD, 1.68 mm2], P < .001). Furthermore, the mean OB area in PD was found to be significantly smaller compared with all other atypical parkinsonisms including CBS, MSA, PSP, VP, ET, and DIP (PD, 4.19 [SD, 0.99] versus CBS 5.40 [SD, 1.23], versus MSA 6.52 [SD, 1.20], versus PSP 5.39 [SD, 1.24], versus VP 5.79 [SD, 1.11], versus ET 7.49 [ SD, 1.31], and versus DIP 7.23 [SD, 1.69 mm2], P < .001, respectively, Fig 2). When we compared the mean area of the OB in patients with PD with (n = 11) and without dysosmia (n = 40), this study revealed that those experiencing dysosmia had significantly smaller OBs than those without this symptom (mean, 3.53 [SD, 0.81] versus 4.21 [SD, 0.84 mm2], P = .02). Furthermore, the OB was significantly smaller in PD without olfactory impairment compared with CBS, MSA, and PSP (P < .001, respectively, Fig 3).

The results of the comparison of the mean OB area among those with PD, atypical parkinsonism, and age-matched HS. The boxplot illustrates the distribution of the mean bilateral OB area across different groups. The boxes represent the interquartile range for each group, with the central line indicating the median. The whiskers show the minimum and maximum values, while points indicate individual data. For neuroradiologist 1, the median is as follows (square millimeter): 4.2 for PD, 6.4 for age-matched HS, 5.7 for CBS, 6.6 for MSA, 5.3 for PSP, 5.5 for VP, 7.2 for ET, and 6.6 for DIP. Meanwhile, for neuroradiologist 2, the median (square millimeter) is 4.0 for PD, 6.3 for age-matched HS, 5.6 for CBS, 7.0 for MSA, 5.2 for PSP, 6.5 for VP, 7.2 for ET, and 7.5 for DIP.

The results of the comparison of the mean OB area among those with PD with and without dysosmia and those with degenerative atypical parkinsonism. The boxplot illustrates the distribution of the mean bilateral OB area across different groups. The boxes represent the interquartile range for each group, with the central line indicating the median. The whiskers show the minimum and maximum values, while points indicate individual data. For neuroradiologist 1, the median is as follows (square millimeter): 3.4 for PD with dysosmia, 4.3 for without dysosmia, 5.7 for CBS, 6.6 for MSA, and 5.3 for PSP. Meanwhile, for neuroradiologist 2, the median is 3.5 for PD with dysosmia, 4.4 for without dysosmia, 5.6 for CBS, 7.0 for MSA, and 5.2 for PSP.
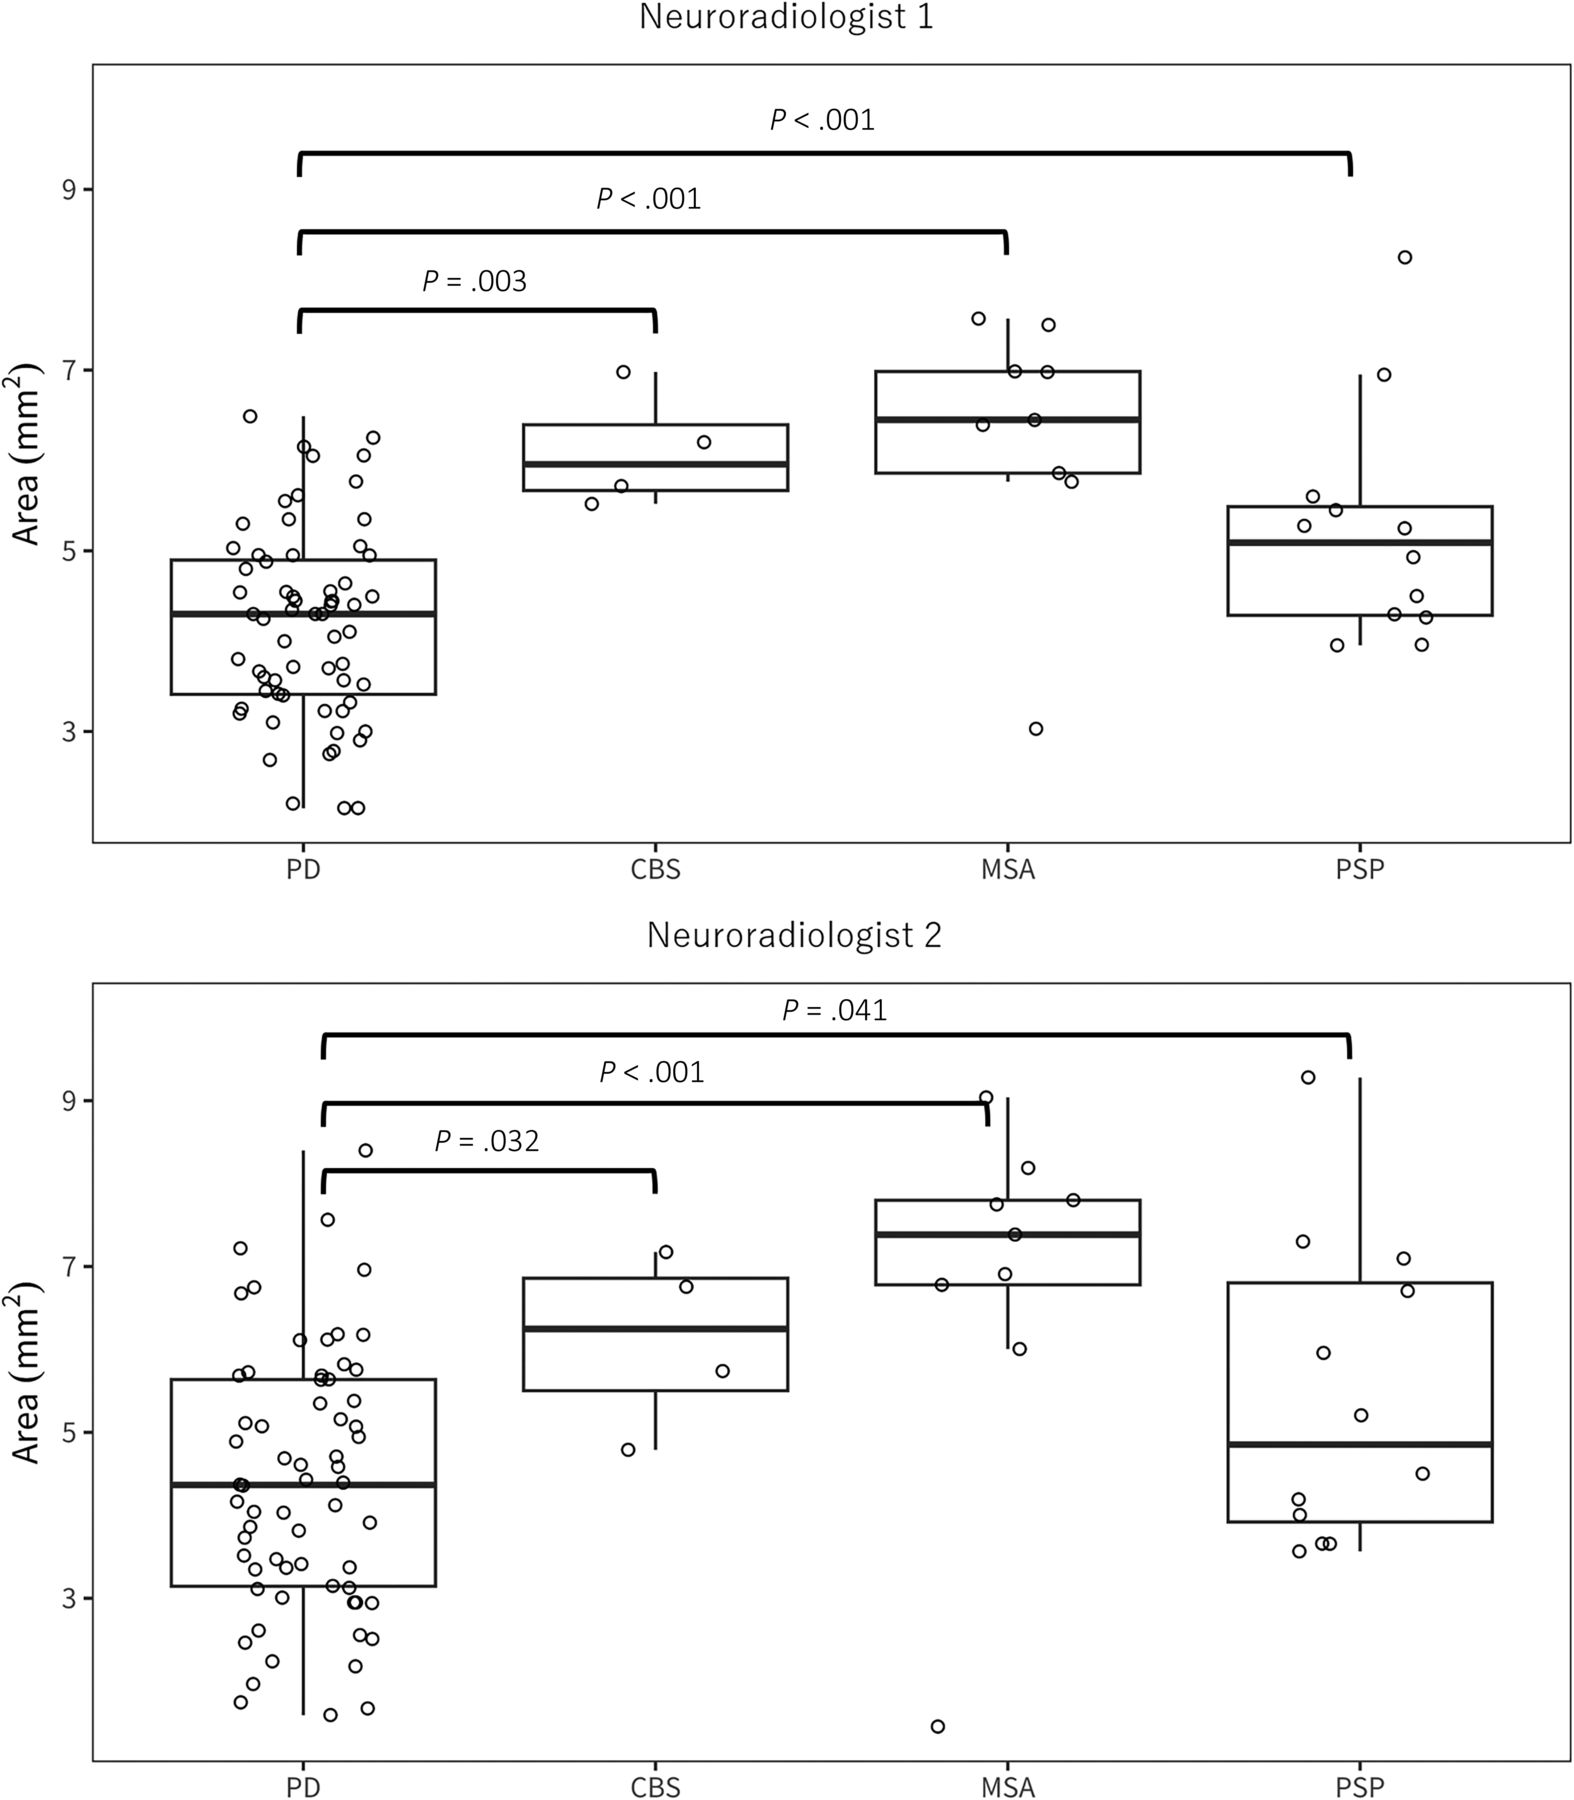
Additionally, in the comparison between HS and other neurodegenerative parkinsonism, CBS and PSP showed a significant reduction in the mean OB (P = .02, and 0.01, respectively), whereas no significant difference was observed in MSA (P = .88). Moreover, we compared the mean OB area in cases within 2 years of symptom onset (PD n = 64, CBS n = 4, MSA n = 9, PSP n = 12). Similar to the overall comparison among cases, PD had a significantly smaller OB area compared with other degenerative parkinsonian syndromes (PD 4.18 [SD, 1.05] versus CBS 6.10 [SD, 0.65], P < .001, versus MSA 6.28 [SD, 1.38], P < .001, versus PSP 5.22 [SD, 1.28 mm2], P = .003, Fig 4). As a result of ANCOVA, neither age, the brain parenchymal fraction, total gray matter volume, estimated total intracranial volume, nor hippocampus volume was found to affect the mean OB area (Online Supplemental Data). No sex difference in OB measurement was observed (Online Supplemental Data).

The result of the comparison of the mean OB area in cases within 2 years of symptom onset. The boxplot illustrates the distribution of the mean bilateral OB area across different groups. The boxes represent the interquartile range for each group, with the central line indicating the median. The whiskers show the minimum and maximum values, while points indicate individual data. For neuroradiologist 1, the median is as follows (square millimeter): 4.3 for PD, 6.0 for CBS, 6.5 for MSA, 5.1 for PSP. Meanwhile, for neuroradiologist 2, the median (square millimeter) is 4.4 for PD, 6.2 for CBS, 7.4 for MSA, 4.9 for PSP.
Evaluation of Conventional MR Imaging
The qualitative assessment results were determined through consensus between the 2 neuroradiologists, with any discrepancies resolved through discussion (Online Supplemental Data). In the CBS group, 12 of 13 (92%) patients had asymmetric cerebral/cerebral peduncle atrophy, and 5 of 13 (38%) patients had corpus callosum atrophy. Conversely, in the MSA group, 8 of 15 (53%) patients showed putaminal atrophy/iron deposition, and 9 of 15 (60%) patients had pontine atrophy/hot cross bun sign. In the PSP group, 10 of 17 (59%) patients had midbrain/SCP atrophy, and only 3 of 17 (18%) patients showed cerebellar atrophy. Remarkably, among patients with PD, 11 of 108 (10%) patients exhibited midbrain/SCP atrophy, while 14 of 108 (13%) patients showed corpus callosum atrophy, indicating the presence of shared findings among different disease groups.
Diagnostic Accuracy of OB Measurement in Differentiating PD from Atypical Parkinsonism
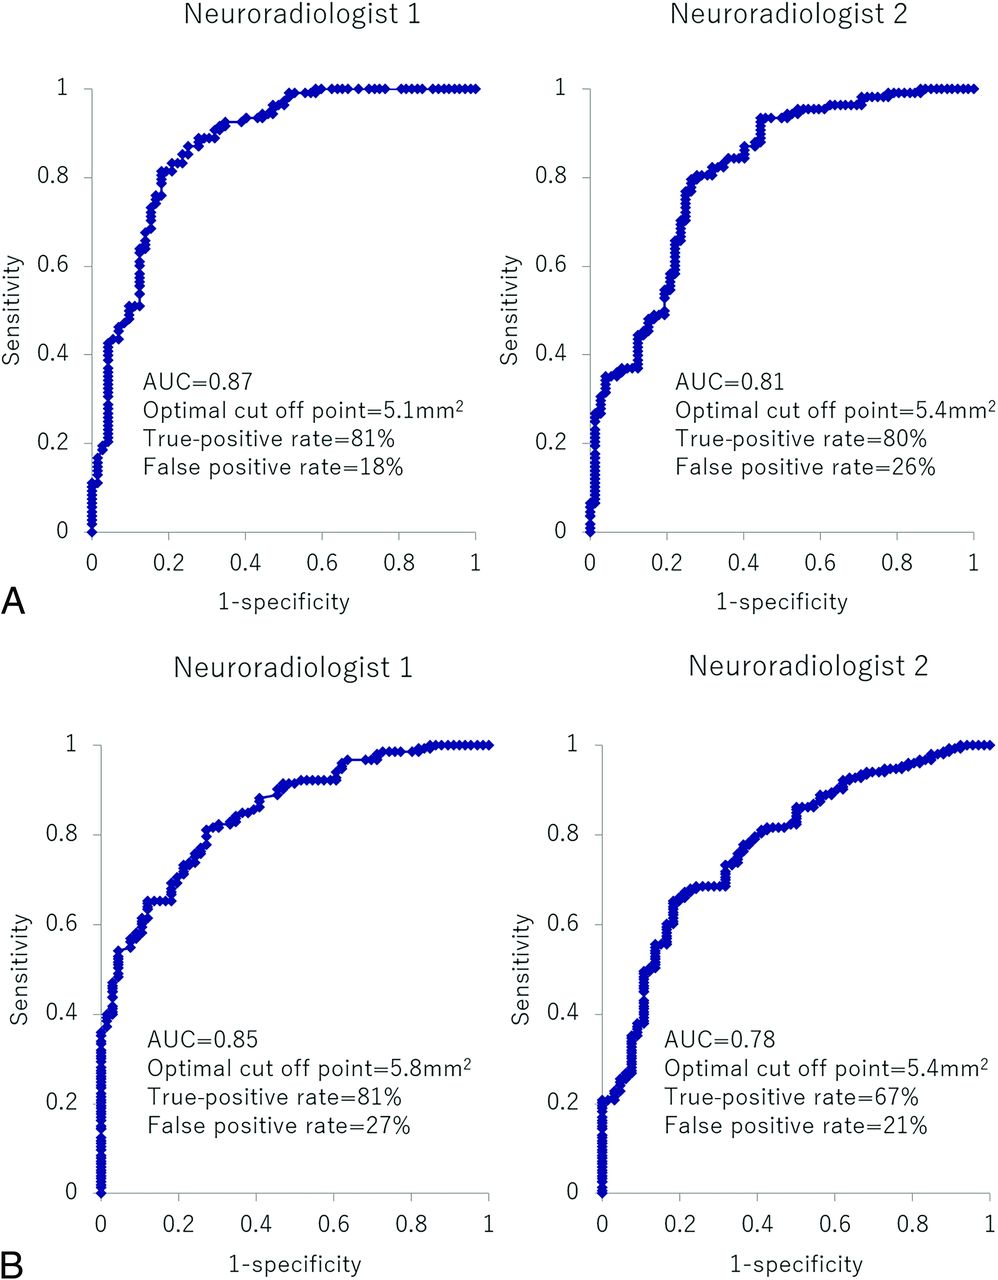
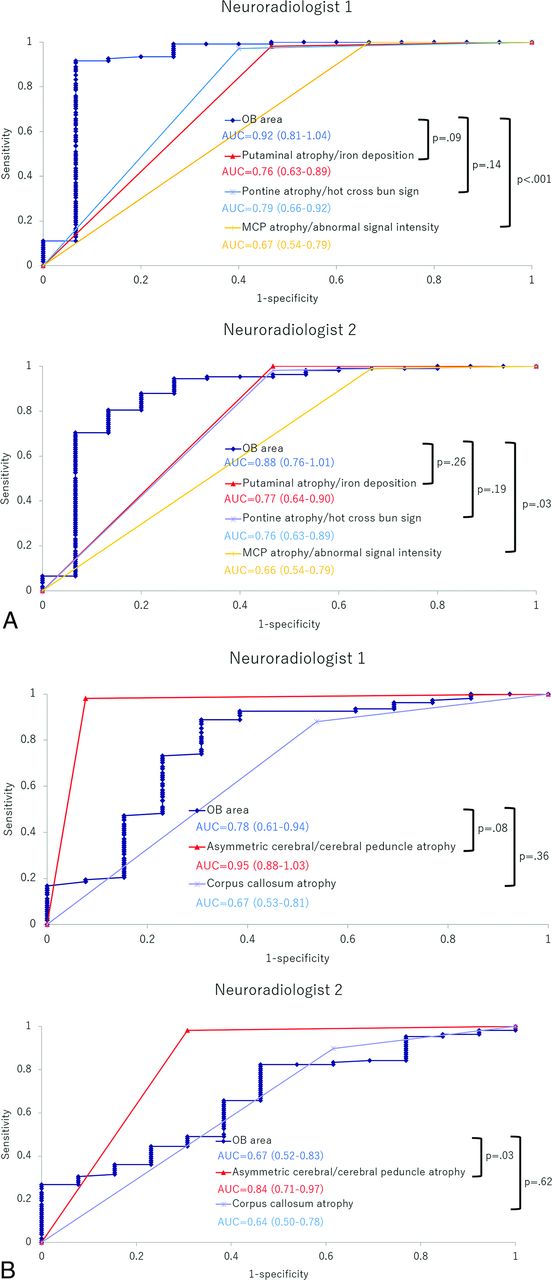
In ROC analysis of the comparison between PD and atypical parkinsonism, measurements of the OB demonstrated high diagnostic accuracy for both neuroradiologist 1 and 2. For neuroradiologist 1, the area under the curve (AUC) was 0.87, and the optimal cutoff point was identified as 5.1 mm2, yielding a true-positive rate of 81% and a false-positive rate of 18% (Fig 5A). In the comparison between degenerative diseases (PD, MSA, CBS, and PSP) and nondegenerative diseases (VP, ET, and DIP) and HS, OB measurement also showed high diagnostic performance: AUC > 0.80 for both neuroradiologists (Fig 5B). In ROC analysis, for neuroradiologist 1, the optimal cutoff value for distinguishing PD from MSA was found to be 5.6 mm2, resulting in an AUC of 0.924, with a sensitivity of 91.7% and specificity of 93.3%, indicating excellent performance. The area under the ROC curve for the OB area was higher than that for the findings of MCP atrophy/abnormal signal intensity (P < .001), as well as putaminal atrophy/iron deposition and pontine atrophy/hot cross bun sign, though the latter differences were not statistically significant (P = .09 and 0.14, respectively, Fig 6A). Additionally, for discriminating between PD and CBS, the cutoff value was determined to be 5.4 mm2, with an AUC of 0.779, sensitivity of 88.9%, and specificity of 69.2%. The AUC for the OB area was smaller than that for asymmetric cerebral/cerebral peduncle atrophy and larger than that for corpus callosum atrophy, though neither difference was statistically significant (P = .08 and .36, respectively, Fig 6B). When distinguishing PD and PSP, the cutoff value was 4.9 mm2, with an AUC of 0.766, sensitivity of 75.9%, and specificity of 64.7%. The AUC for the OB area was larger than that for cerebellar atrophy (P = .002) and midbrain/SCP atrophy, though in the latter case, there was no significant difference (P = .81, Fig 6C).

ROC curve analysis of OB measurement for differentiation of Parkinson disease from atypical parkinsonism (MSA, CBS, PSP, VP, ET, and DIP) (A), and for the differentiation of degenerative disease (PD, MSA, CBS, and PSP) from nondegenerative disease (VP, ET, and DIP) and HS (B).


ROC curve analysis of image parameters for differentiation of PD from MSA (A), CBS (B), and PSP (C), based on the results from each of two neuroradiologists.
DISCUSSION
This study demonstrated that the mean OB area in PD was notably smaller than that in HS and all other atypical parkinsonism cases, and this finding was accompanied by excellent interobserver reproducibility. This distinction was apparent even in the early stages of the disease, within its first 2 years. Furthermore, even in PD without olfactory impairment, it would be possible to distinguish between them and atypical parkinsonism by measuring the OB. The mean OB area was more diagnostic than standard MR imaging findings for MSA, especially when differentiating PD from MSA with a mean area threshold of 5.6 mm2, achieving an AUC of 0.924. To the best of our knowledge, this is the first report that demonstrates the usefulness of OB area measurement in differentiating PD from all other atypical parkinsonisms (AUC of 0.87 for neuroradiologist 1, and 0.81 for neuroradiologist 2 in ROC analysis), which can be a clinical differential diagnosis. The strengths of this study over prior work include a larger PD patient sample, consistent results using 3D FIESTA with high interobserver reproducibility, coverage of potential differential diagnoses for PD, a comparison with reported MR imaging findings, and the potential of OB measurements for early diagnosis.
As noted in prior studies, PD leads to the degeneration and atrophy of the olfactory nerve due to Lewy body accumulation within it.3 While the sense of smell remains relatively intact in atypical parkinsonism, it suggests minimal or no olfactory nerve degeneration.25 The cause of mild OB atrophy in degenerative atypical parkinsonism compared with HS in our study remains uncertain. However, in Alzheimer disease, known for olfactory dysfunction, both amyloid-β and τ are found in cortical olfactory regions, like the anterior olfactory nucleus and piriform cortex, potentially leading to olfactory degeneration.26 Similarly, degenerative atypical parkinsonism might cause secondary OB degeneration, albeit to a lesser extent, due to abnormal protein buildup in the brain. We posit that secondary OB degeneration is the primary reason for the marked difference in OB area between PD, causing direct olfactory nerve degeneration, and degenerative atypical parkinsonism. ET, DIP, and VP do not induce primary neuronal degeneration. Ioflupane 123I (DAT scan) SPECT can identify nigrostriatal tract degeneration, aiding in distinguishing degenerative atypical parkinsonism from these disorders.27 In this respect, we think that no olfactory nerve atrophy occurred in ET, DIP, and VP. Thus, comparing OB measurements could differentiate them from PD.
In this study, patients with PD with dysosmia had smaller OBs than those without this issue. This finding aligns with previous research, suggesting more advanced OB degeneration in patients with PD with dysosmia.11 As mentioned earlier, the presence of olfactory dysfunction often points to a clinical diagnosis of PD. Conversely, its absence complicates the differentiation between PD and atypical parkinsonism. Most important, our findings reveal that OB measurements can distinguish atypical parkinsonism from PD, even in cases of PD without dysosmia.
Distinguishing PD from atypical parkinsonism in the early stages of the disease is challenging. Our study indicates that the OB in PD is notably smaller than in atypical parkinsonism, even in the first 2 years of symptom onset. Moreover, our findings reveal no correlation between PD duration and OB area (Online Supplemental Data), hinting that OB atrophy is largely established by the time symptoms manifest. This finding aligns with prior studies emphasizing the role of olfactory dysfunction in early PD diagnosis.25
Compared with conventional MR imaging, OB measurement demonstrated superior diagnostic accuracy in distinguishing MSA/PSP from PD. In a comparison of CBS and PD, OB measurements failed to outperform conventional MR imaging findings, because 92% of patients in the CBS group showed specific asymmetric cerebral/cerebral peduncle atrophy. However, a prior MR imaging study of 13 patients reported this typical CBS finding in only 33% (4 patients),28 suggesting some debate over its reliability. The small sample size of this study (n = 13) may have overestimated the usefulness of the findings. Therefore, the evaluation of OB measurements together with conventional MR images may be helpful in the diagnosis of PD.
Previous investigators identified the optimal imaging protocol for evaluating the OB as using 2D-coronal T1 or T2WI with a section thickness of 3 mm and a pixel resolution of 0.47 × 0.47 mm,11 complemented by a 3D driven equilibrium radiofrequency reset pulse (DRIVE) with a thickness of 1 mm and a voxel resolution of 0.4 × 0.5 × 1.0 mm13. The DRIVE approach, using a balanced steady-state free precession technique, is similar to our FIESTA imaging method. In our study, we used the FIESTA imaging protocol, which has a 1-mm section thickness and a voxel resolution of 0.7 × 0.6 × 1.0 mm. We believe this protocol provides a reasonable comparison with previous methods. Achieving high spatial resolution is crucial for precise OB assessment, yet it is essential to avoid excessively long imaging times. Although those prior studies did not specify their imaging times, we believe the imaging time of 1 minute 58 seconds is feasible for a routine MR imaging protocol in patients with suspected parkinsonism.
Brain volumetry studies in PD have documented atrophy in the corpus callosum and hippocampus, each linked to cognitive decline.29,30 It is also reported that reductions in fractional anisotropy occur in both the corpus callosum and hippocampus concurrently and are associated with the severity of freezing of gait,31 which may be intricately related to pathogenesis of PD. Therefore, we conducted ANCOVA to assess the impact of common brain volume indices (including gray matter volume, total intracranial volume, brain parenchymal fraction) and hippocampal volume on OB measurements. The results indicated that none of these indices significantly affected the OB measurements, suggesting that the diagnosis of PD is a significant contributor to OB measurement.
This study has several limitations. First, we assessed the OB area in its largest coronal section rather than its volume. Volumetric measurements can be useful for assessing changes in the whole olfactory nerve,11 but a simple method is necessary for daily practice. The small size of the olfactory nerve makes volume measurement with our standard PACS viewer difficult. Therefore, we chose a simpler method, visually evaluating and measuring the area of the largest cross-section. In the present study, it was found that the OB area correlates with volume, and we think that measuring the area is reasonable. Second, this study included a considerable number of patients with PD with undetermined olfactory impairment due to its retrospective nature. In addition, the patients were also grouped according to subjective symptoms, not by a thorough examination by an otolaryngologist. Future prospective studies should further explore the value of OB measurements in the differential diagnosis, considering the presence or absence of olfactory issues. Third, the limited number of cases, particularly those of atypical parkinsonism, which are challenging to diagnose clinically, could affect the results. Fourth, only 2 image evaluators were involved. It would be beneficial to have evaluations conducted by a greater number of radiologists, including trainees to reinforce the findings. This suggestion is considered an area for future research. Last, the diminutive size of the OB might introduce measurement inaccuracies. The olfactory nerve is a very small structure, making it crucial to ensure reproducibility in its measurements. Hence, it is necessary to select the largest possible cross-section for evaluation and assess a cross-section that is perpendicular to the long axis of the olfactory nerve. Consequently, slight differences in the selection of the evaluation cross-section or the angle of the acquired image may influence the results. However, given the relatively good interobserver reproducibility, we believe the OB measurement methodology used in this study is valid.
CONCLUSIONS
Our study indicated that the mean OB area in PD was significantly smaller compared with HS and atypical parkinsonism, with consistent reproducibility between observers. This distinction was apparent even within the first 2 years of the disease onset. The OB area measurement was more indicative than conventional MR imaging markers commonly seen in MSA and PSP.
Footnotes
Disclosure forms provided by the authors are available with the full text and PDF of this article at www.ajnr.org.
References
- Received December 10, 2023.
- Accepted after revision March 6, 2024.
- © 2024 by American Journal of Neuroradiology


