Graphical Abstract

Abstract
BACKGROUND AND PURPOSE: In acute ischemic stroke, the amount of “local” CBF distal to the occlusion, ie, all blood flow, whether supplied antegrade or delayed and dispersed through the collateral network, may contain valuable information regarding infarct growth rate and treatment response. DSC processed with a local arterial input function (AIF) is one method of measuring local CBF (local-qCBF) and has been shown to correlate with collateral supply. Similarly, intravoxel incoherent motion MRI (IVIM) is “local,” with excitation and readout in the same plane, and a potential alternative way to measure local-qCBF. This work compares IVIM local-qCBF against DSC local-qCBF in the ischemic penumbra, compares the measurement of perfusion-diffusion mismatch (PWI/DWI), and examines if local-qCBF may improve prediction of the final infarct.
MATERIALS AND METHODS: Eight experiments in a preclinical canine model of middle cerebral artery occlusion were performed. Native collateral circulation was quantified via x-ray DSA 30 minutes postocclusion, and collateral supply was subsequently enhanced in a subset of experiments with simultaneous pressor and vasodilator. IVIM, DSC, and DWI MRI were acquired 2.5 hours postocclusion. IVIM was postprocessed to return local-qCBF from fD*, water transport time (WTT) from D*, diffusion from D, and the PWI/DWI mismatch. These were compared with DSC parameters processed first with a standard global-AIF and then with a local-AIF. These DSC parameters included time-to-maximum, local MTT, standard-qCBF, local-qCBF, and PWI/DWI mismatch. Infarct volume was measured with DWI at 2.5 hours and 4 hours postocclusion.
RESULTS: Two and one-half hours postocclusion, IVIM local-qCBF in the noninfarcted ipsilateral territory correlated strongly with DSC local-qCBF (slope = 1.00, R2= 0.69, LinCCC = 0.77). Correlation was weaker between IVIM local-qCBF and DSC standard-qCBF (p = 0.38, R2 = 0.13). DSC local-qCBF and IVIM local-qCBF in the noninfarcted ipsilateral territory both returned strong prediction of final infarct volume (R2 = 0.78, R2 = 0.61, respectively). DSC standard-qCBF was a weaker predictor (R2 = 0.12). The hypoperfused lesion from DSC local-qCBF and from IVIM local-qCBF both predicted final infarct volume with good sensitivity and correlation (slope = 2.08, R2 = 0.67, slope = 2.50, R2 = 0.68, respectively). The IVIM PWI/DWI ratio was correlated with infarct growth (R2 = 0.70), and WTT correlated with DSC MTT (slope = 0.82, R2 = 0.60).
CONCLUSIONS: Noncontrast IVIM measurement of local-qCBF and PWI/DWI mismatch may include collateral circulation and improve prediction of infarct growth.
ABBREVIATIONS:
- AIF
- arterial input function
- Gd
- gadolinium
- IR
- inversion recovery
- IVIM
- intravoxel incoherent motion
- MCAO
- middle cerebral artery occlusion
- MD
- mean diffusivity
- qCBF
- quantitative cerebral blood flow
- Tmax
- time to maximum
- WTT
- water transport time
SUMMARY
PREVIOUS LITERATURE:
In ischemic stroke, the “local” nature of IVIM with excitation and readout in the same plane allows it to image all capillary motion. This includes blood flow from the collateral network, even if it has arrived delayed and dispersed relative to antegrade flow. Similarly, correcting DSC quantitative CBF (qCBF) for this delay and dispersion by using a local AIF improves agreement with collateralization. While IVIM in stroke has predominately been compared with standard DSC, comparison of IVIM local-qCBF to DSC local-qCBF may improve agreement and demonstrate how local-qCBF could add valuable information to stroke imaging.
KEY FINDINGS:
In a canine model of middle cerebral artery occlusion, IVIM local-qCBF in the ipsilateral MCA territory correlated strongly with DSC local-qCBF (R2 = 0.69), and weakly with DSC standard-qCBF (R2 = 0.16). Local-qCBF returned a stronger prediction of final infarct volume (DSC R2 = 0.78, IVIM R2 = 0.61) than standard-qCBF (R2 = 0.12). IVIM PWI/DWI ratio was strongly correlated with infarct growth (R2 = 0.70).
KNOWLEDGE ADVANCEMENT:
These findings support 1) IVIM as a noncontrast method of measuring local-qCBF, including collateral circulation, in acute stroke, 2) improved agreement of IVIM and DSC with a local-AIF, and 3) using simultaneous perfusion-weighted and diffusion-weighted images from IVIM for PWI/DWI mismatch.
Acute ischemic stroke occurs when sudden loss of blood supply to a region of the brain leads to damaged or dead brain cells. Rapid early intervention by thrombectomy or thrombolysis after symptom onset1 is most effective in treating stroke.2,3 However, large multicenter trials4⇓-6 have suggested that the treatment window can be extended for some patients. This “late thrombectomy” can be performed 6 to 24 hours after symptom onset, which is a crucial extension for patients with unknown onset time. Patient eligibility for late thrombectomy may be determined by the “mismatch” between 1) the hypoperfused lesion distal to an occlusion imaged with PWI and 2) the amount of irretrievable, dead/infarcted brain imaged with DWI.7,8 This PWI-DWI mismatch is one measure of the penumbra, which may be useful for patient triage and novel stroke therapeutic studies.9⇓⇓⇓-13
Hypoperfusion can be measured as prolonged time-to-maximum (Tmax) or delayed arrival time of the contrast bolus.14 However, even when delayed bolus makes regions of the brain appear hypoperfused, some of these regions may be sustained by collateral circulation.15,16 “Local” CBF distal to the occlusion, ie, all blood flow, whether supplied antegrade or delayed and dispersed through the collateral network, is one way of measuring this collateral circulation. Including collateral circulation in perfusion imaging may provide more complete pathophysiologic information for each patient, improve patient selection for reperfusion therapy, and better predict infarct growth.15⇓-17 Recently, DSC CBF with a local arterial input function (AIF)20 has been shown to measure local quantitative CBF (local-qCBF in mL/100 g/min) that correlates with collateralization and infarct growth better than standard DSC.18 Similarly, intravoxel incoherent motion (IVIM) MRI perfusion fraction has shown promise as a method of imaging collateral flow.19 As such, imaging local-qCBF with IVIM may add valuable information about collateral circulation, hypoperfusion in the ischemic penumbra, and infarct growth.
This work aims to examine the use of noncontrast IVIM to measure local-qCBF and measure the ischemic penumbra in acute ischemic stroke. To study the nature of the local flow, IVIM parameters are compared with both local-AIF DSC and standard DSC parameters in a preclinical canine model of acute middle cerebral artery occlusion (MCAO). First, it compares IVIM local-qCBF to DSC local-qCBF and DSC standard-qCBF in the ischemic penumbra. Second, it compares the predictive ability of hypoperfusion lesions from local-qCBF versus standard-qCBF against final infarct. Finally, it uses IVIM simultaneous local-qCBF PWI and DWI ratio to predict infarct growth and compares it to the PWI/DWI ratio from DSC Tmax, DSC local-qCBF, and DSC standard-qCBF.
MATERIALS AND METHODS
Theory
Contrast bolus is delayed and dispersed when traveling around an occlusion through the collateral network. Mathematically, standard DSC perfusion analysis may not include compensatory blood that travels through collaterals if this delay is not corrected.20 This means that standard DSC without correction may overestimate the hypoperfusion lesion when there are good collaterals. Use of a voxelwise local-AIF has been shown to correct this delay.21,22 With a local-AIF generated for every voxel, rather than a standard single global-AIF in a brain-feeding artery, DSC local-qCBF captures all of the perfusion in a voxel, including collateral circulation.18
In theory, IVIM local-qCBF in the penumbra should more closely agree with DSC local-qCBF than standard DSC, especially in cases with good collateral circulation. This is because IVIM is local, with excitation and readout on the same plane.24 It measures capillary flow independent of contrast bolus arrival by separating intravoxel motion into blood pseudo-diffusion and tissue diffusion.23 Both Local-AIF DSC and IVIM should be sensitive to all the blood in capillaries, whether supplied antegrade or retrograde through the collateral network.18,19 The speed of the capillary motion can also estimate how long it would take for 50% of the original molecules in a volume to diffuse out24; this theoretically could be comparable to local-AIF DSC mean transit time. Further details of the theory behind local-qCBF are available in the Supplemental Data.
Preclinical Canine Model
All experiments were conducted by using a previously reported preclinical canine model of ischemic stroke.25 The 2-day experimental protocol was approved by the University of Chicago Institutional Animal Care and Use Committee and reported in compliance with ARRIVE guidelines. The University of Chicago is an AAALAC International accredited institution adhering to the following guidelines, regulations, and policies: a) Guide for the Care and Use of Laboratory Animals (National Research Council), b) USDA Animal Welfare Act and Animal Welfare Regulations, and c) Public Health Service Policy on Humane Care and Use of Laboratory Animals.
Eight canines (mean age =3.4 ± 3.9 years, mean weight = 25.3 ± 5.0 kg, 7 female, 1 male) underwent permanent endovascular MCAO via embolic occlusion coils under fluoroscopic guidance with R/L randomization. M1 occlusion was verified via selective internal carotid and vertebral arteriography.25 Native collateral circulation was quantified 30 minutes post-MCAO by assessing x-ray arteriographic images (OEC9800; GE Healthcare) with a pial collateral score26 modified for canines as described previously.16 Further details of the canine model and collateral scoring are available in the Supplemental Data. To evaluate a larger range of collateral supply, 5 of 8 subjects underwent flow augmentation (simultaneous pressor and vasodilator norepinephrine and hydralazine); treated and untreated subjects were pooled. In previous work, this flow augmentation has been shown to increase collateral circulation and slow infarct growth by disruption of cerebral autoregulation of poor collaterals.13,27
MRI Acquisition
MRI was acquired 2.5 hours after occlusion with a 3T MRI scanner (Ingenia, Philips) head-first, prone position with a 15-channel receive-only coil. Sequences were acquired with DSC, followed by DTI, and then IVIM.
DSC images (coronal plane, 2D gradient-echo, T2*-weighted EPI, FOV/matrix =160 mm/176, 5 slices/6 mm thick, TR/TE =500/30, 120 phases, total scan time = 60 seconds) were taken along with rapid 15-second T1 maps following the “T1-bookend method”21,22,28⇓⇓⇓⇓⇓-34 (2D inversion recovery [IR] Look-Locker, single-shot EPI FOV/matrix =160 mm/176, 5 slices/6 mm thick). Gadolinium (Gd)-based contrast agent (Multihance, Bracco) followed by a saline flush (Gd: 3 mL at 2 mL/s, saline: 20 mL at 2 mL/s) was injected in the forepaw.
DTI for mean diffusivity (MD), analogous to more widely used ADC, was acquired to measure infarct volume every 30 minutes post-MCAO and track infarct growth over time.16 A stack of 50 2D DTI slices was prescribed to cover the entire head (slice thickness = 2 mm, FOV = 128×128 mm/matrix = 128× 128, TR/TE = 2993/83 ms, flip angle = 90°, b-values = 0, 800 seconds/mm2, 32 directions).
Multi b-value DWI for IVIM was collected with 10 b-values (0, 111, 222, 333, 444, 556, 667, 778, 889, 1000 seconds/mm2) and 3 orthogonal directions. Scans covered the entire head (2D single-shot EPI, TR/TE= 3056/91 ms, 50 slices/2 mm thick, FOV/matrix = 224 mm/128 or FOV/matrix 160 mm/96, total scan time = 5.5 minutes, SENSE Factor = 2). The MR protocol is available in the Supplemental Data.
DSC Analysis
DSC local-qCBF was postprocessed in mL/100 g/min by using the well-established T1-bookend method21,22,28⇓⇓⇓⇓⇓-34 with a voxel-by-voxel local-AIF. This local-AIF corrected for the late arrival (delay) and “blunting” (dispersion) of the contrast bolus as it propagated through the brain22 and included collateral supply in the ischemic penumbra.18
DSC was also processed with a standard single global-AIF and quantified as standard-qCBF with the same T1-bookend method. Tmax was calculated as the time at which the residue function reached its maximum after deconvolution from the global-AIF. Further details of the T1-bookend method and processing with the 2 AIFs are available in the Supplemental Data.
DWI Analysis
DWI core infarct was defined, as previously reported,27 as MD <0.00057 from DTI mean diffusivity and converted to binary infarction maps. Final infarct volume was calculated from the DTI, which was taken 4 hours post-MCAO, as infarct growth had likely steadied by that time.16,25
IVIM Analysis
IVIM local-qCBF (in mL/100 g/min) and diffusion (in mm2/s) values were calculated from the 10 b-values by using a 2-step segmented fit.23,35⇓⇓⇓-39 IVIM D (tissue diffusion) was fit on a voxelwise basis to the second component of the standard IVIM bi-exponential  for b-values >250 seconds/mm2. After fitting IVIM D, the pseudo diffusion components
  and
and  were fit to the whole equation by using nonlinear least squares. The parameter
  was quantified as local-qCBF (in mL/100 g/min) by using the water transport time (WTT) model,24 local-qCBF
  93,000 [mL/100 g/min]. IVIM core infarct was defined as IVIM D < 0.000515. This threshold was chosen to agree most closely with DWI total core infarct volume by using leave-one-out cross-validation from the previous study.40 Further details on IVIM postprocessing are available in the Supplemental Data.
After postprocessing, the IVIM parameter maps were coregistered and resized to overlap anatomically with DSC images for direct region-of-interest comparison. Three consecutive IVIM slices were averaged to match the coarser DSC slice thickness of 6 mm. Previously reported leave-one-out cross-validation T2 map thresholds,24,40 D* >0.10 seconds/mm2 and f >0.30,19,41 were applied to remove CSF-dominated voxels and minimize partial volume effects without the use of a T2-prepared IR pulse for CSF suppression.37
qCBF in Ipsilateral MCA Territory and Final Infarct
Two and one-half hours postocclusion, the ipsilateral MCA territory was defined as the region of the brain that would normally be supplied by the occluded (right or left) MCA. The average values of IVIM local-qCBF and DSC local-qCBF in the ipsilateral MCA territory that was not infarcted (ie, MD >0.00057) were compared with each other via linear regression and Bland-Altman. The average DSC and IVIM local-qCBF in this noninfarcted MCA territory were also used to predict final infarct volume by linear regression. IVIM local-qCBF was also compared with DSC standard-qCBF. All analyses were performed in 3 consecutive 6-mm coronal slices starting at, and posterior to, the M1 segment for both DSC and IVIM images.
qCBF in the Contralateral MCA Territory
The contralateral MCA territory was defined as the region of the brain that was supplied by the not occluded (right or left) MCA. The average values of IVIM local-qCBF and DSC local-qCBF in this contralateral MCA territory were compared with each other via linear regression. IVIM local-qCBF was also compared with DSC standard-qCBF. These analyses were performed in the same 3 slices as the ipsilateral MCA territory.
Early Hypoperfused Lesion and Final Infarct Volume
The 2.5 hours hypoperfused lesion was calculated first as the volume of the brain with DSC local-qCBF < 26 mL/100 g/min, second as DSC Tmax > 1 second,18 and third as IVIM local-qCBF < 26 mL/100 g/min. Correlation of the hypoperfusion lesion against the final 4 hours of infarct volume was measured by linear regression. Note that the hypoperfused lesion was independent of DWI measurements; it was only based on thresholded local-qCBF, which could possibly include tissue that had already infarcted. Hypoperfused lesion from standard-qCBF was also calculated by thresholding at 26 mL/100 g/min.
Perfusion-Diffusion Mismatch Ratio and Infarct Growth
The PWI/DWI volume ratio was calculated from DSC local-qCBF, IVIM local-qCBF, and Tmax values. The PWI volume was defined as the hypoperfused lesion described above. For DSC local-qCBF, standard-qCBF, and Tmax, the DWI volume was the core infarct (MD <0.00057 mm2/s) volume. For IVIM, the DWI volume was IVIM D < 0.000515 mm2/s. Using IVIM D meant that the IVIM PWI/DWI could use images only from the IVIM sequence and allowed simultaneous PWI and DWI. The PWI/DWI ratio of the hypoperfused lesion volume to the core infarct volume was compared via linear regression to the change in infarct volume between the time of the perfusion scans and the final 4 hours infarct. The PWI/DWI mismatch was also calculated from the standard-qCBF hypoperfused lesion.
Hypoperfusion from Local Temporal Parameters
Hypoperfusion lesions calculated from slowed transit time from local-AIF DSC MTT and IVIM WTT were generated based on varying transit time thresholds from 1–10 seconds. The volumes from the thresholds were compared to examine correlation and agreement. To reduce the sensitivity to noise, values over 20 seconds were excluded as being “unphysical.” More details on the DSC MTT and IVIM WTT are available in the Supplemental Data.
Statistics
Linear regression, Bland-Altman, and Lin Concordance Correlation Coefficient were used to compare IVIM local-qCBF against DSC local-qCBF and standard-qCBF in the MCA territory. Linear regression was used for correlation of local-qCBF and standard-qCBF hypoperfused lesions against DWI final infarct and for correlation of the 2.5 hours PWI/DWI ratio against infarct growth. Paired Wilcoxon signed-rank and linear regression were used to compare all equivalent measures between IVIM, Local-AIF DSC, and standard DSC. All statistical analysis was performed in Python 3.11.4 (Anaconda, 2024). A P value <.05 was considered statistically significant.
RESULTS
Eighty-three percent of the parent study experiments were successful and performed to completion (this current study analyzed the successful cases with completed IVIM, T1-bookend DSC, 2.5 hours, and 4 hours DTI). Access to all results, raw images, and tabulated data are available upon request to the corresponding author.
Perfusion and Diffusion Maps
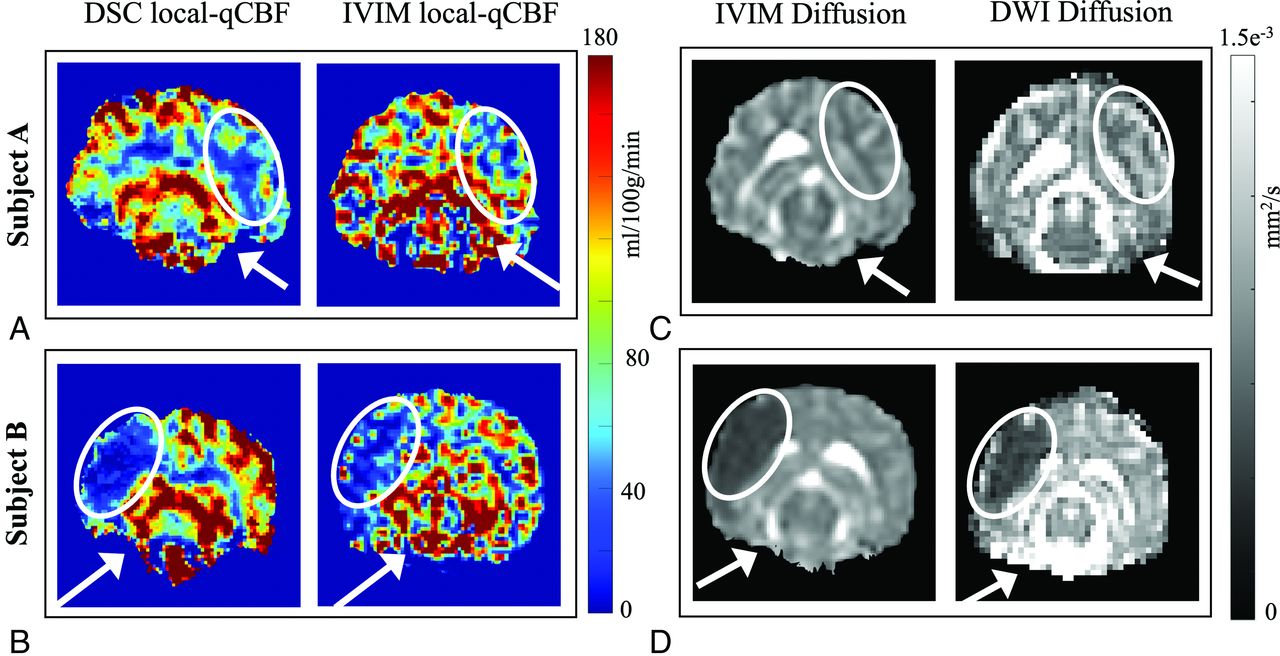
Example images of DSC local-qCBF, IVIM local-qCBF maps, IVIM D, and MD infarct maps acquired 2.5 hours post-MCAO are shown in Fig 1, with 3 IVIM slices averaged and resized to match DSC. Subject A was in the control group and had a good native collateral score, as shown by x-ray angiography. The bottom row shows the corresponding images for Subject B in the control group with a poor native collateral score. Note the pronounced difference in ipsilateral perfusion in a setting of good collaterals (Fig 1A versus Fig 1B). In both cases, the IVIM local-qCBF is similar to the DSC local-qCBF. The corresponding maps of the IVIM D and DTI MD are also shown (Fig 1C, -D). Note that in Subject A, the perfusion is reduced (Fig 1A), but tissue viability is maintained (Fig 1C), whereas in Subject B, both DSC and IVIM local-qCBF showed compromised CBF (Fig 1B) and a large core infarct (Fig 1D) with minimal salvageable PWI-DWI mismatch.

A comparison of local-qCBF in mL/100 g/min between DSC and IVIM for subject A with good collateral circulation (A) and subject B with poor collateral circulation (B). DSC was fully quantitative and corrected for arterial delay and dispersion effects, and IVIM was quantified with water transport time. The corresponding diffusion maps are shown in (C) and (D), respectively. White arrows denote the position of the MCA coil; white ovals denote the MCA territory. IVIM local-qCBF is averaged across 3 slices to match the 6-mm slice thickness of DSC, and along with an automatic T2 threshold, voxels with D*>10 and/or f > 0.30 are excluded to remove fast-flowing CSF-dominated voxels.
qCBF in the Ipsilateral MCA Territory
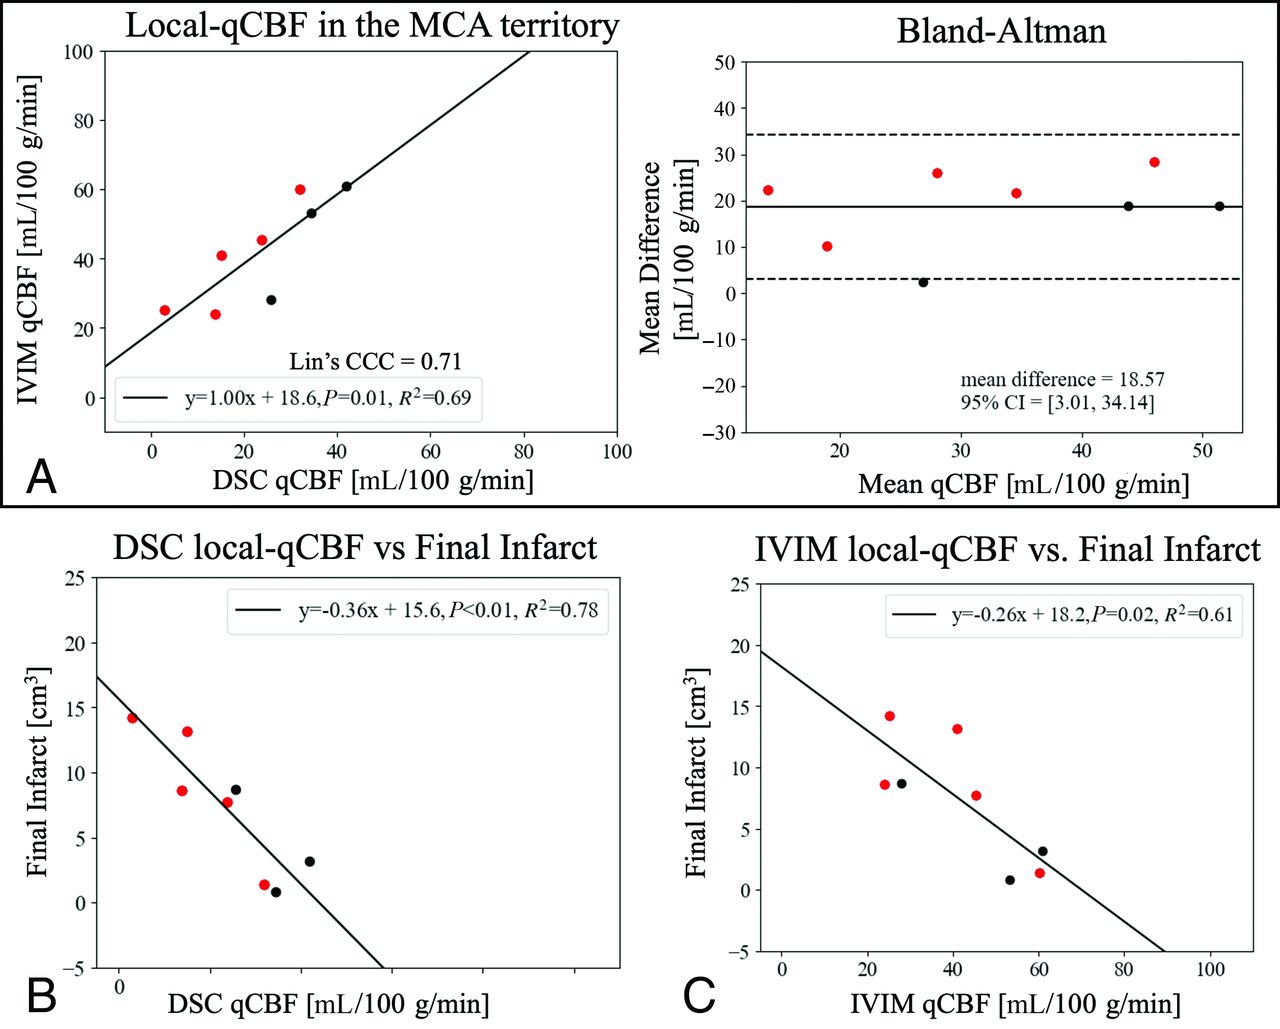
DSC and IVIM local-qCBF in the noninfarcted MCA territory strongly correlated (Fig 2A ) across collateral status and flow augmentation. Bland-Altman showed a significant unbiased mean difference (+19 mL/100 g/min), with IVIM local-qCBF higher than DSC local-qCBF (Table). In comparison, the correlation between IVIM local-qCBF and DSC standard-qCBF was not significant (R2=0.13, P = .38). Lower DSC local-qCBF and IVIM local-qCBF in the noninfarcted ipsilateral MCA territory correlated with larger final infarct (R2 =
  respectively; Fig 2B, -C). DSC local-qCBF was the strongest predictor, and IVIM local-qCBF was also a stronger predictor than DSC standard-qCBF for prediction of final infarct (
 ).
).

A, Correlation and linear regression of IVIM local-qCBF against DSC local-qCBF in the noninfarcted MCA territory 2.5 hours post-MCAO with corresponding Bland-Altman plot. Final (4 hours) infarct volume correlated against (B) DSC local-qCBF and (C) IVIM local-qCBF. Experiments were pooled over treatment and baseline collateralization to expand the range of collateral circulation. Red represents those that received flow augmentation.
Comparable parameters between IVIM, local-AIF DSC, and standard DSCa
qCBF in the Contralateral MCA Territory
Correlation of IVIM local-qCBF in the contralateral MCA territory was similar between DSC local-qCBF and DSC standard-qCBF (R2 = 0.57, P = .02;  respectively). Again, the IVIM returned higher local-qCBF than both versions of DSC (Table).
Hypoperfused Lesion Against Final Infarct Volume
A larger 2.5-hour IVIM local-qCBF hypoperfusion lesion predicted a larger final 4-hour infarct volume (Fig 3). IVIM performed similarly to DSC local-qCBF hypoperfusion (Fig 3B, -C) while both outperformed Tmax hypoperfusion (Fig 3A) Local-qCBF hypoperfusion lesions were smaller than the standard-qCBF hypoperfusion lesions (Table), though only DSC local-qCBF was statistically significantly smaller than DSC standard-qCBF lesions (P = .023). DSC standard-qCBF hypoperfusion lesions showed a weaker correlation with final infarct volume than local-qCBF (
 versus Fig 3B, -C).

The hypoperfused lesion at 2.5 hours post-MCAO was a predictor of final infarct volume for hypoperfusion defined as (A) Tmax > 1s, (B) DSC local-qCBF <26 mL/100 g/min, and (C) IVIM local-qCBF <26 mL/100 g/min. Experiments were pooled over treatment and baseline collateralization to expand the range of collateral supply. Red represents those that received flow augmentation.
Perfusion-Diffusion Mismatch Ratio and Infarct Growth
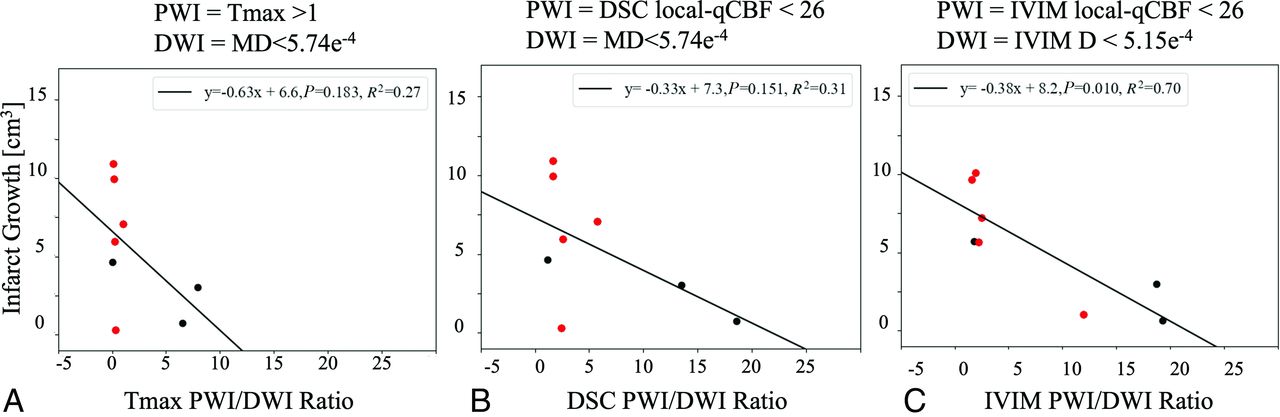
The PWI/DWI ratio from Tmax and DSC local-qCBF showed a negative correlation with infarct growth (Fig 4A, -B). IVIM PWI/DWI ratio returned a stronger correlation, potentially due to its ability to capture simultaneous perfusion and diffusion in a single scan and avoid coregistration or timing mismatch (Fig 4C).

The PWI/DWI ratio of the hypoperfused lesion to core infarct at 2.5 hours post-MCAO correlated against the infarct growth between the perfusion scan and the final 4-hour infarct. The PWI lesions are defined by thresholding (A) Tmax, (B) DSC local-qCBF, and (C) IVIM local-qCBF. The DWI lesions are defined by (A and B) coregistered mean diffusivity and (C) IVIM D. Experiments were pooled over treatment and baseline collateralization to expand the range of collateral supply. Red represents those that received flow augmentation.
Perfusion Time Parameters
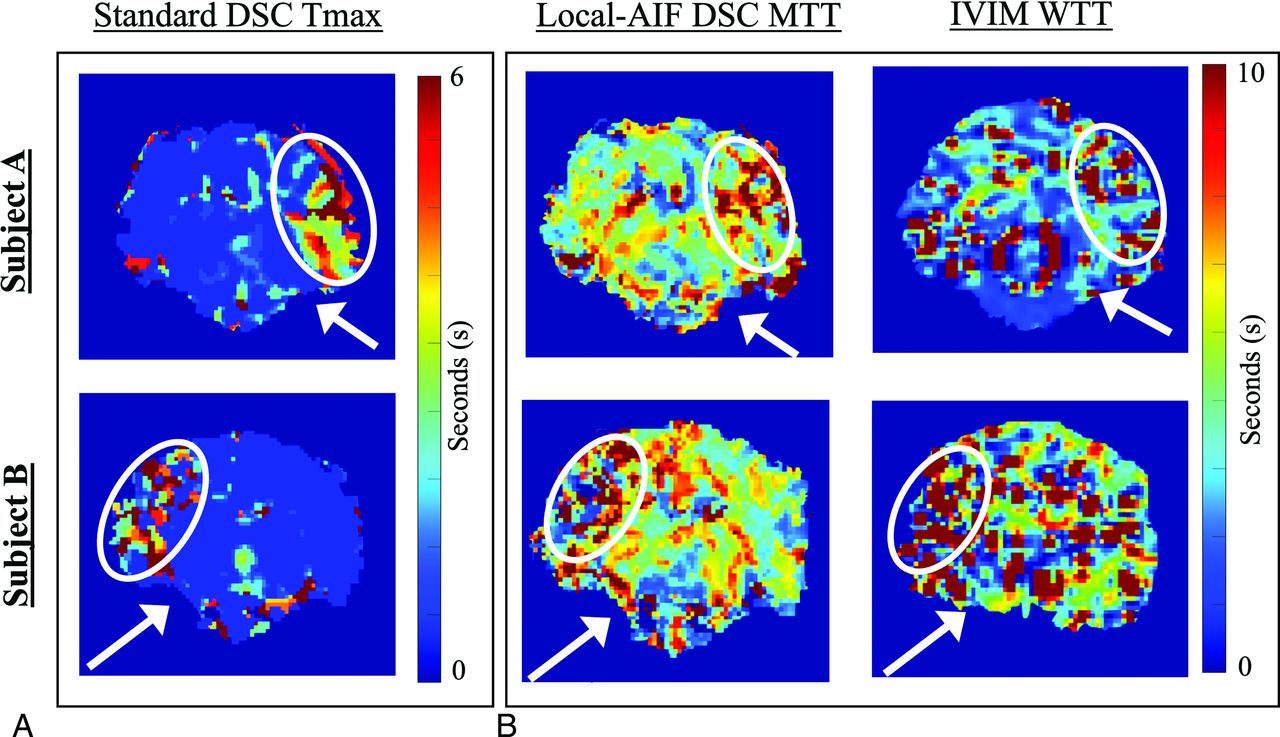
Representative images of DSC Tmax, DSC MTT, and IVIM WTT are shown for the subjects from Fig 1 as parametric images in Fig 5. Thresholding IVIM WTT at 3s returned the strongest correlation against DSC MTT at 3 seconds ( ). One case was left out of analysis but included in the plot as a yellow outlier (Supplemental Data). This case highlighted the difficulty of fitting IVIM decay to the standard bi-exponential,42 as the curve fit returned low IVIM blood fraction
f but normal
). One case was left out of analysis but included in the plot as a yellow outlier (Supplemental Data). This case highlighted the difficulty of fitting IVIM decay to the standard bi-exponential,42 as the curve fit returned low IVIM blood fraction
f but normal  supporting the product
  being more accurate than individual parameters due to error correlation.43

A, Tmax and B, MTT and IVIM WTT for the same Subject A (top row, good collaterals) and Subject B (bottom row, bad collaterals) from Fig 1. Tmax is calculated from standard DSC to capture the delayed arterial bolus. MTT is calculated from local-AIF DSC to capture local perfusion speed. WTT is the inverse of D* and represents the intravoxel diffusion speed. White arrows denote the position of the MCA coil; white ovals denote the MCA territory. To reduce the fitting sensitivity as the inverse of D*, WTT values over 20 seconds were removed from consideration.
DISCUSSION
This study demonstrated IVIM as a method of measuring local-qCBF, including collateral circulation, and perfusion-diffusion mismatch in acute ischemic stroke. DSC and IVIM both independently quantified local-qCBF in mL/100 g/min, correlated strongly, and predicted final infarct volume. As DSC local-qCBF has previously been shown to correlate with collateral score, IVIM local-qCBF correlating strongly with DSC local-qCBF supports IVIM including collateral circulation in acute stroke.18,19 Further, this work supports the potential benefit of combining temporal parameters and volume into blood flow44 with both DSC local-qCBF and IVIM local-qCBF outperforming Tmax for hypoperfusion and PWI/DWI mismatch. As IVIM is sensitive to local motion of capillary blood, IVIM avoids the complexities of bolus-tracking methods and captures simultaneous quantitative local perfusion and diffusion without contrast agent.
Imaging collateral circulation is valuable to stroke research and therapeutic studies. Even if collateral circulation may arrive delayed and dispersed after having traversed the collateral network, it can still provide vital nutrients and oxygen to prevent infarction. This may explain why good collateral circulation has been shown to influence endovascular treatment outcome15 as well as a time-to-treatment window.45 As such, PWI/DWI mismatch that includes collateral circulation from local-qCBF may help identify patients with good collaterals who can undergo late thrombectomy safely.5,6,46 Further, research on novel stroke therapeutics that could boost native collateral circulation and extend the stroke treatment window may benefit from an ability to image local-qCBF.12,13,27,47,48
As proposed by Liu et al18 collateral supply can be included in DSC local-qCBF with a local-AIF that corrects delay and dispersion. Further, Federau et al19 proposed IVIM “local perfusion fraction,” as a measure of collateral blood supply that standard DSC could not capture. The correlation of IVIM local-qCBF to DSC local-qCBF in this current work shows that the 2 methods of measuring “local perfusion” agree. This supports IVIM capturing compensatory native and augmented collateral circulation in acute stroke. In addition, IVIM local-qCBF, DSC local-qCBF, and DSC standard-qCBF agreed in the contralateral MCA territory. This supports the theory that the difference between local-qCBF and standard-qCBF is due to the collateral circulation in the ipsilateral hemisphere that standard-qCBF does not capture.
A subject with higher collateral circulation would be expected to have higher local-qCBF in the ipsilateral MCA territory and smaller final infarct. IVIM local-qCBF demonstrated this trend with higher local-qCBF predicting lower final infarct volume. The use of flow augmentation to boost collateral circulation in this study meant IVIM could not be directly compared with native collateral score. However, as DSC local-qCBF has demonstrated strong correlation with collateral score in previous works, the agreement of IVIM local-qCBF to DSC local-qCBF supports a similar correlation. It should be noted that the flow augmentation in this study was previously observed to increase collateral circulation only in subjects with lower native collaterals.13,27 This may be why the treatment group (red) in this work did not always return a higher ipsilateral perfusion with smaller final infarct volume than the control group (black), as seen in Fig 2.
The PWI/DWI mismatch ratio showed negative correlation with future infarct growth. The noninfarcted MCA territory may be receiving collateral circulation with reduced blood flow containing vital nutrients and oxygen. However, there is no guarantee that the collateral circulation will be sustained. Interestingly, the PWI/DWI ratio from IVIM measurements outperformed DSC and Tmax in predicting future infarct growth. As IVIM local-qCBF and DSC local-qCBF themselves showed strong agreement, the improvement of PWI/DWI with IVIM may be due to IVIM imaging simultaneous PWI and DWI, while DSC required a separate DWI MR sequence. Further, IVIM PWI and DWI have the same FOV and resolution, while Tmax and DSC did not match the DWI dimensions, requiring imperfect coregistration.
The positive bias in the Bland-Altman analysis of IVIM perfusion and DSC perfusion (Fig 2B) may be due to motion other than capillary-level blood, such as interstitial fluid and CSF in subarachnoid space. As IVIM is not contrast or spin-labeled, all motion in a voxel will contribute to signal.37,38 Since inversion recovery to suppress CSF will also suppress blood,24,37 instead an automatic T2 threshold was applied to remove CSF-dominated voxels,24,40 and f and D* were thresholded. However, partial volume contamination could still lead to overestimation of blood signal. Removal with T2-prepared CSF suppression37 could reduce the offset.
Significant correlation between WTT and MTT supports IVIM WTT as an estimation of local transit time, while the offset highlights limited robustness and the effect of noise in  . Mathematically, the inverse of
  may return falsely high WTT values when
  is fit to a low value. As the
  parameter alone has shown problems with robustness,49 we only calculated quantitative qCBF as
  averaged across an ROI and for calculation of volumes by thresholding;
  was not used as a quantitative value on a voxelwise basis nor for visual analysis.
Previous work has found a correlation between IVIM and DSC35,38,41 predominately correlating standard DSC CBV and IVIM f, which avoids the complications of  and may be more reliable. However, the correlations seen in this study by using IVIM local-qCBF and WTT against DSC local-qCBF and MTT show improved correlation, supporting the value of a time component from IVIM and use of a more stable
  estimation. Further, IVIM local-qCBF and PWI/DWI ratio in acute stroke has not previously been compared with DSC local-qCBF for prediction of final infarct.
As IVIM is noncontrast, it could capture PWI/DWI mismatch throughout infarct progression without issues of multiple contrast injections.32 The ability to image longitudinal development of potential penumbra, track perfusion-diffusion mismatch over time, and study infarct growth could aid in preclinical studies of novel stroke therapeutics. One recent study also supports IVIM in the ischemic penumbra correlating with clinical outcome.50
This study is not without its limitations. IVIM is still subject to CSF and interstitial fluid contamination, despite use of a T2-weighted threshold. Use of T2 preparation IR pulse37 may be of benefit in future studies. Gd-contrast prevented comparison of IVIM and DSC throughout infarct progression; if Gd is injected multiple times over the development of infarct progression, some contrast will remain and confound quantification of blood flow. An analysis of IVIM local-qCBF and PWI/DWI mismatch as the stroke develops over time would be a worthwhile investigation. Difficulties related to fitting IVIM data and noise prevented voxelwise comparison to DSC MRI; images were analyzed region-by-region rather than voxel-by-voxel. Further, this work does not study the influence of b-value selection. The complexities of the model and physiologic monitoring prevented perfect temporal agreement of DTI, DSC, and IVIM data. Voxel size and FOV differences prevented perfect coregistration. While heart rate and blood pressure were monitored, fluctuations were inevitable. The conservative number of subjects used in this study limits statistical interpretation and significance. Translation of conclusions derived from animal-based models is a potential limitation, but animal models reduce errors when evaluating methods for qCBF calculation with known occlusion time infarct development which is not possible in humans. While a method of imaging PWI/DWI with collateral circulation throughout infarct development has use in preclinical research and stroke therapeutics, use of MRI in stroke triage in the United States is limited.
CONCLUSIONS
IVIM local-qCBF correlated strongly with DSC local-qCBF, hypoperfusion lesion from DSC local-qCBF and IVIM local-qCBF predicted final infarct volume, and IVIM simultaneous PWI/DWI ratio for ischemic penumbra predicted infarct growth. This supports 1) IVIM as a noncontrast method of local-qCBF that includes collateral circulation, 2) improved agreement of IVIM and DSC with a local-AIF, and 3) IVIM as a viable candidate for longitudinal measurement of simultaneous perfusion and diffusion in preclinical stroke research.
Footnotes
This research has been supported by the US National Institutes of Health R01-NS093908 (Carroll/Christoforidis) and The National Science Foundation DGE-1746045 (Liu).
Disclosure forms provided by the authors are available with the full text and PDF of this article at www.ajnr.org.
References
- 1.
- 2.
- 3.
- 4.
- 5.
- 6.
- 7.
- 8.
- 9.
- 10.
- 11.
- 12.
- 13.
- 14.
- 15.
- 16.
- 17.
- 18.
- 19.
- 20.
- 21.
- 22.
- 23.
- 24.
- 25.
- 26.
- 27.
- 28.
- 29.
- 30.
- 31.
- 32.
- 33.
- 34.
- 35.
- 36.
- 37.
- 38.
- 39.
- 40.
- 41.
- 42.
- 43.
- 44.
- 45.
- 46.
- 47.
- 48.
- 49.
- 50.
- Received November 11, 2024.
- Accepted after revision January 2, 2025.
- © 2025 by American Journal of Neuroradiology