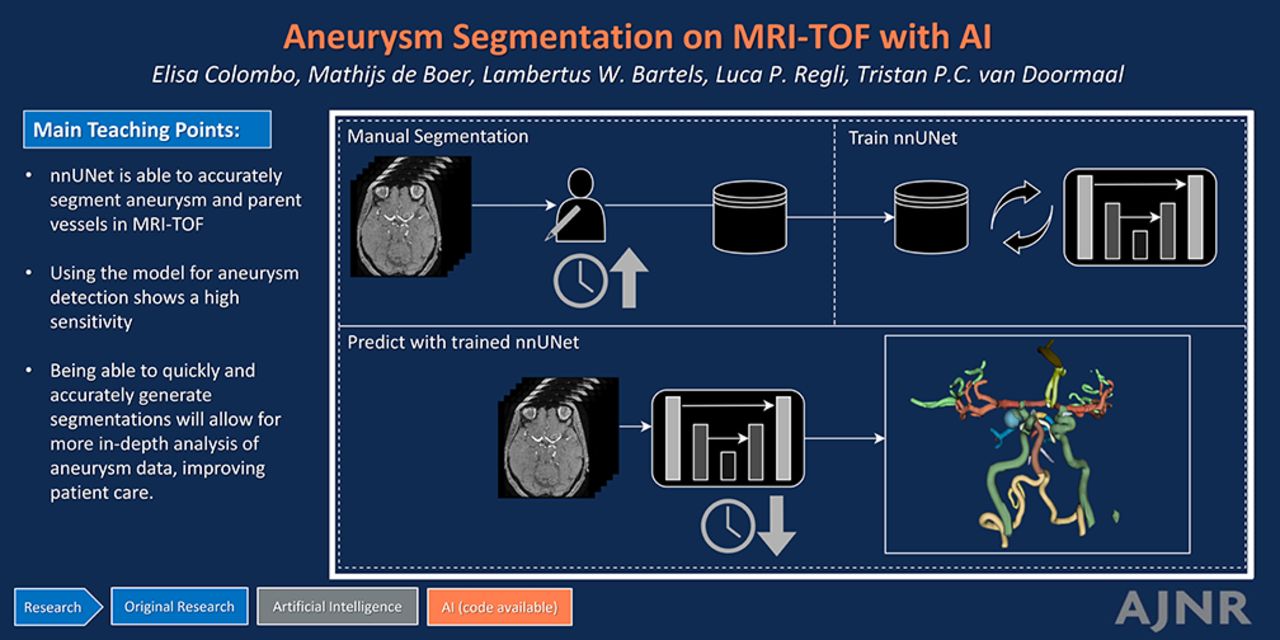
Graphical Abstract

Abstract
BACKGROUND AND PURPOSE: The automatic recognition of intracraial aneurysms by means of machine-learning algorithms represents a new frontier for diagnostic and therapeutic goals. Yet, the current algorithms focus solely on the aneurysms and not on the recognition of their parent vessels. The purpose of the present study is the development of a new machine-learning algorithm for fully automatic identification of cerebral arteries and intracranial aneurysms (IAs) based on a manually segmented MRA-TOF data set.
MATERIALS AND METHODS: In this retrospective single-center study, 62 MRA-TOF scans of a total of 73 untreated, unruptured IAs were manually color-labeled in 21 classes. A nnUNet architecture was trained on MRA-TOF images. The performance of the automatic segmentation was compared with the manual segmentation by using the Dice Similarity Coefficient (DSC), Centerline Dice (ClDice), and 95th percentile Hausdorff Distance (HD95). Sensitivity was computed for aneurysm detection.
RESULTS: Across all 21 classes, the median DSC was 0.86 [95% CI: 0.81–0.89], the median ClDice was 0.91 [0.85, 0.94], and the median HD95 was 2.9 [1.0, 14.9] mm. Sensitivity of the model for aneurysm detection was 0.8. For this class specifically, a median DSC of 0.88 [0.13, 0.92], median ClDice of 0.89 [0.06, 1.0], and median HD95 of 1.8 [0.58, 81] mm was achieved. The volume of the labeled anatomic structure was the most relevant determinant of accuracy in this model. Median time to predict was 130.6 [60.9, 284.1] seconds.
CONCLUSIONS: The nnUNet MRA-TOF–based algorithm provided a fast and adequate automatic extraction of unruptured IAs, their parent vessels, and the most relevant cerebral arteries. Future steps involve the expansion of the training set with the inclusion of more MRA-TOF studies with and without IAs and its incorporation in 3D imaging viewers and treatment prediction.
ABBREVIATIONS:
- ACA
- anterior cerebral artery
- AComm
- anterior communicating artery
- BA
- basilar artery
- ClDice
- Centerline Dice
- DL
- deep learning
- DSC
- Dice Similarity Coefficient
- FN
- false-negative
- FP
- false-positive
- HD95
- 95th percentile Hausdorff Distance
- IA
- intracranial aneurysm
- ML
- machine learning
- PCA
- posterior cerebral artery
- PComm
- posterior communicating artery
- TP
- true-positive
SUMMARY
PREVIOUS LITERATURE:
While a number of authors also tried to develop an automatic, fast, and accurate segmentation of IAs based on data sets of 3D MRA-TOF scans (summarized in Table 2), the presented algorithm may provide possible advantages and diversifies from prior published attempts.
KEY FINDINGS:
With a median DSC of 0.86 across all segmented classes, the performance of the presented algorithm proves acceptable for segmentation of medical images. Furthermore, with a median DSC of 0.85 for aneurysms, and a sensitivity of 0.8, our algorithm performs quite well compared with prior attempts.
KNOWLEDGE ADVANCEMENT:
The presented algorithm provides an automatic, precise, and fast segmentation not only of IAs but concomitantly also of the most relevant intracranial vessels, which can be very relevant for tailoring aneurysm management. Furthermore, it is built for integration onto a MxR system, which is a unique aspect.
Intracranial aneurysms (IAs) are pathologic ectasias of intracranial arteries present in approximately 3% of the population worldwide.1 While most IAs remain asymptomatic and may be diagnosed incidentally, a discrete percentage of them may be symptomatic by exerting mass effect on nearby structures or by rupturing.2 Rupture of an IA represents a relevant cause of nontraumatic SAH with associated high risk of morbidity and mortality.3 Therefore, accurate identification and risk stratification of IAs, as well as adequate anatomic understanding and tailored therapeutic approach are of paramount importance in neuroradiology and neurosurgery.
Although pretherapeutic imaging modalities have been developing fast in the past decades, for IAs the standard imaging techniques for the therapeutic decision making remain 2D and mostly without annotations. However, the complex anatomic configuration of IAs and their individual hemodynamic characteristics do require a precise pretherapeutic 3D visualization. Automatic segmentation of IAs and intracranial arteries from which they rise as well as those that surround them with the goal of rendering them 3D may be crucial for an effective treatment planning. A 3D understanding of the anatomy, size, and surrounding structures may empower tailored interventions to individual patient needs, potentially enhancing outcomes.4 Furthermore, segmentation allows highlighting specific aspects of the anatomy that may be relevant to the treatment and therefore, it may aid the pretherapeutic in risk assessment, allowing for timely monitoring and decisions. Segmentation of IAs combined with their parent vessels provides a major advantage from a clinical point of view, given that anatomic understanding and surgical planning of IAs cannot be separated from their specific relation to the parent vessels.
MRA-TOF is a noninvasive tool routinely utilized to identify symptomatic and asymptomatic IAs, that demonstrated a diagnostic performance featured by high sensitivity and a largely variable specificity. Applying the MIP method, a 3D-volumetric vessel visualization can be constructed from MRA-TOF images.5 However, this methodology does not allow automatic extraction of the IAs and does not facilitate the understanding of the anatomic spatial relationships. Furthermore, user interaction and manipulation of a volumetric reconstruction is very limited as compared with a 3D deformable surface model. Accurate segmentation of cerebral vessels may be difficult to achieve, given their complex geometry, limited spatial resolution, and image contrast.
The use of machine learning (ML) and in particular deep learning (DL) for medical image segmentation has seen a strong growth over the past years. One important development in the context of medical image segmentation was the development of the U-Net,6 which was initially designed for segmentation with limited data sets, such as the ones that are common in medicine. An extension of the U-Net is the nnU-Net,7 which automates design decisions based on features of the data set. A nnU-Net is able to automate the selection of a great deal of hyperparameters by incorporating a priori and domain knowledge, allowing it to achieve a high performance with little to no manual tuning.
In this context, the value of automated recognition of IAs and parent vessels, as well as their 3D reconstruction as surface models and visualization is potentially very high. An automatic ML algorithm may provide physicians with a fast and accurate method for detection and localization of of IAs. Here, the authors test the application of nnU-Net, for the use of automatic segmentation of intracranial arteries and IAs from 3D MRA-TOF images.
MATERIALS AND METHODS
All patients provided general consent for medical and imaging data use under KEK PB_2017_00093/NCT01628406. The local ethical committee decided that further institutional review board approval was not necessary for this study.
The present analysis was performed following and in accordance to the methodology of the Checklist for Artificial Intelligence in Medical Imaging (CLAIM) checklist.
Subject and Image Acquisition
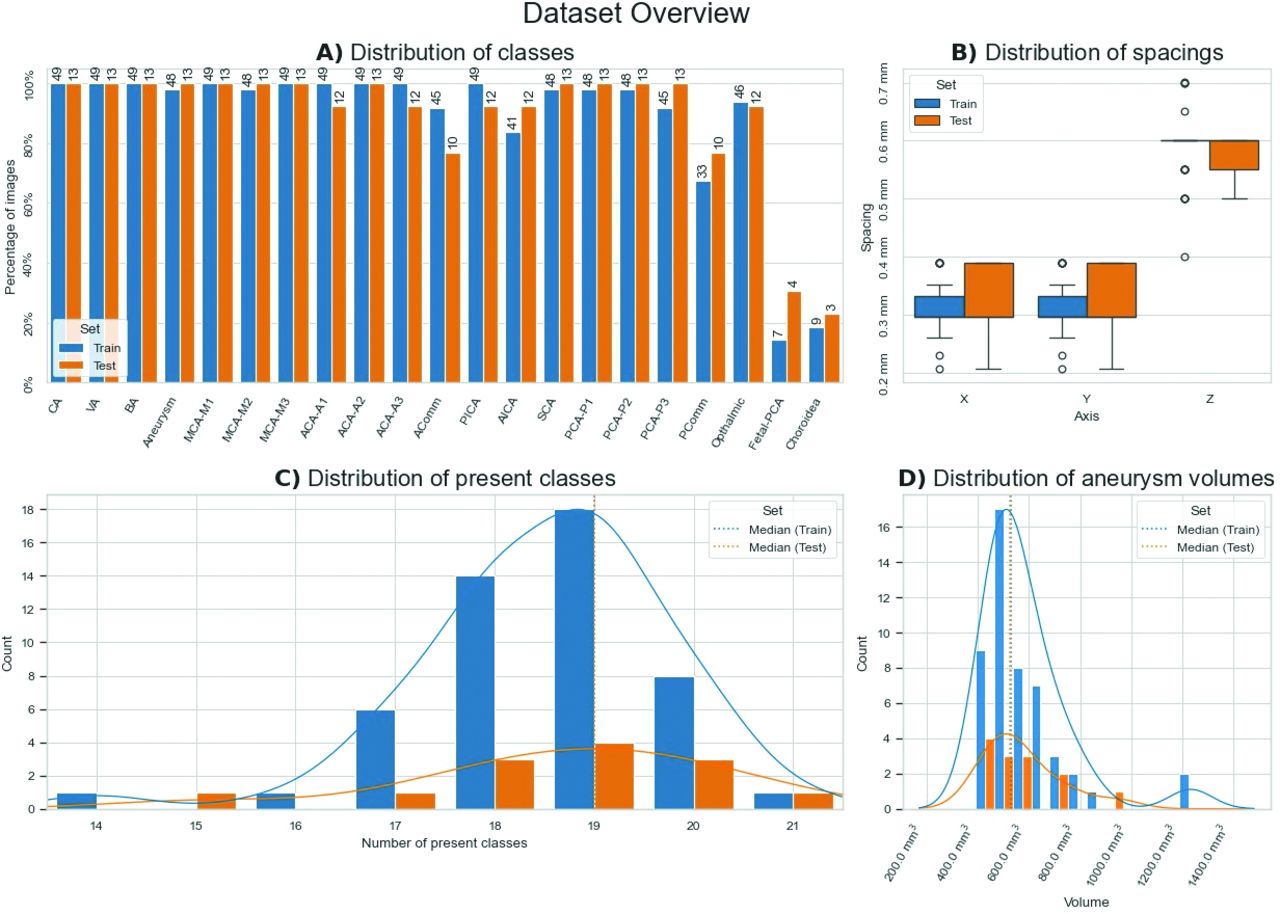
Sixty-two diagnostic MRA-TOF studies, acquired at different centers in Switzerland on different 3T MRI machines documenting 1 or multiple unruptured and untreated IAs were retrospectively included. MRA-TOF sequences represent the standard diagnostic strategy in patients with unruptured IAs and no previously clipped IAs in our institution. Among the included studies, 1 scan documented a giant aneurysm. Scans showing anatomic variants, such as missing anterior communicating artery (AComm) or posterior communicating artery (PComm) or presence of a fetal posterior cerebral artery (PCA), were also included. Figure 1 provides an overview of the anatomic structures present in the data set and their frequency of appearance.

Data set features visualized. This overview displays for both the training and testing data and stresses their comparability. A, The distribution of classes. The bar height indicates the percentual amount of images that contain a specific class. The number above indicates the absolute amount of images that contain that specific class. B, The distribution of voxel spacing in mm for all 3 spatial axes. C, The amount of patients with a certain number of available classes, with the median values for both sets indicated by the dashed vertical line. Note that due to their close proximity they almost completely overlap. D, The distribution of aneurysm volumes in cm3, with the median indicated by the dashed vertical line.
Inclusion and Exclusion Criteria
To be included in this study, each MRI-TOF scan had more than 100 slices, it was acquired on a 3T MRI machine, and documented the presence of 1 or more unruptured IAs. Studies with a lower imaging quality and bearing infundibula were excluded from the analysis.
Data on Representation of Each IA in the Data Set
No medical data other than information on the IAs were collected. Furthermore, the radiologic data of all patients were completely anonymized by converting the DICOM images to NIfTI. This removes all metadata not required to visualize the scans, such as name and surname, age, and sex.
Training Set and Test Set
The imaging database utilized consisted of 62 MRA-TOF scans from various MRI scanners, including a total of 73 IAs. The patient scans were randomly divided into 2 sets, the training set and the test set in an 80:20 ratio, respectively. The test set was not used during training to act as an independent verification of model performance through unseen data. For an overview of data set features, see Fig 1. To reduce the amount of points of failure, and to keep the data as close to the clinical presentation as possible, we did not perform any preprocessing.
Manual Segmentations
All manual segmentations were performed by the first author (E.C.: experienced neurosurgical resident with specific training on 3D imaging processing) and controlled by the second author and the senior author (T.v.D.: vascular neurosurgeon with more than 15 years of experience).
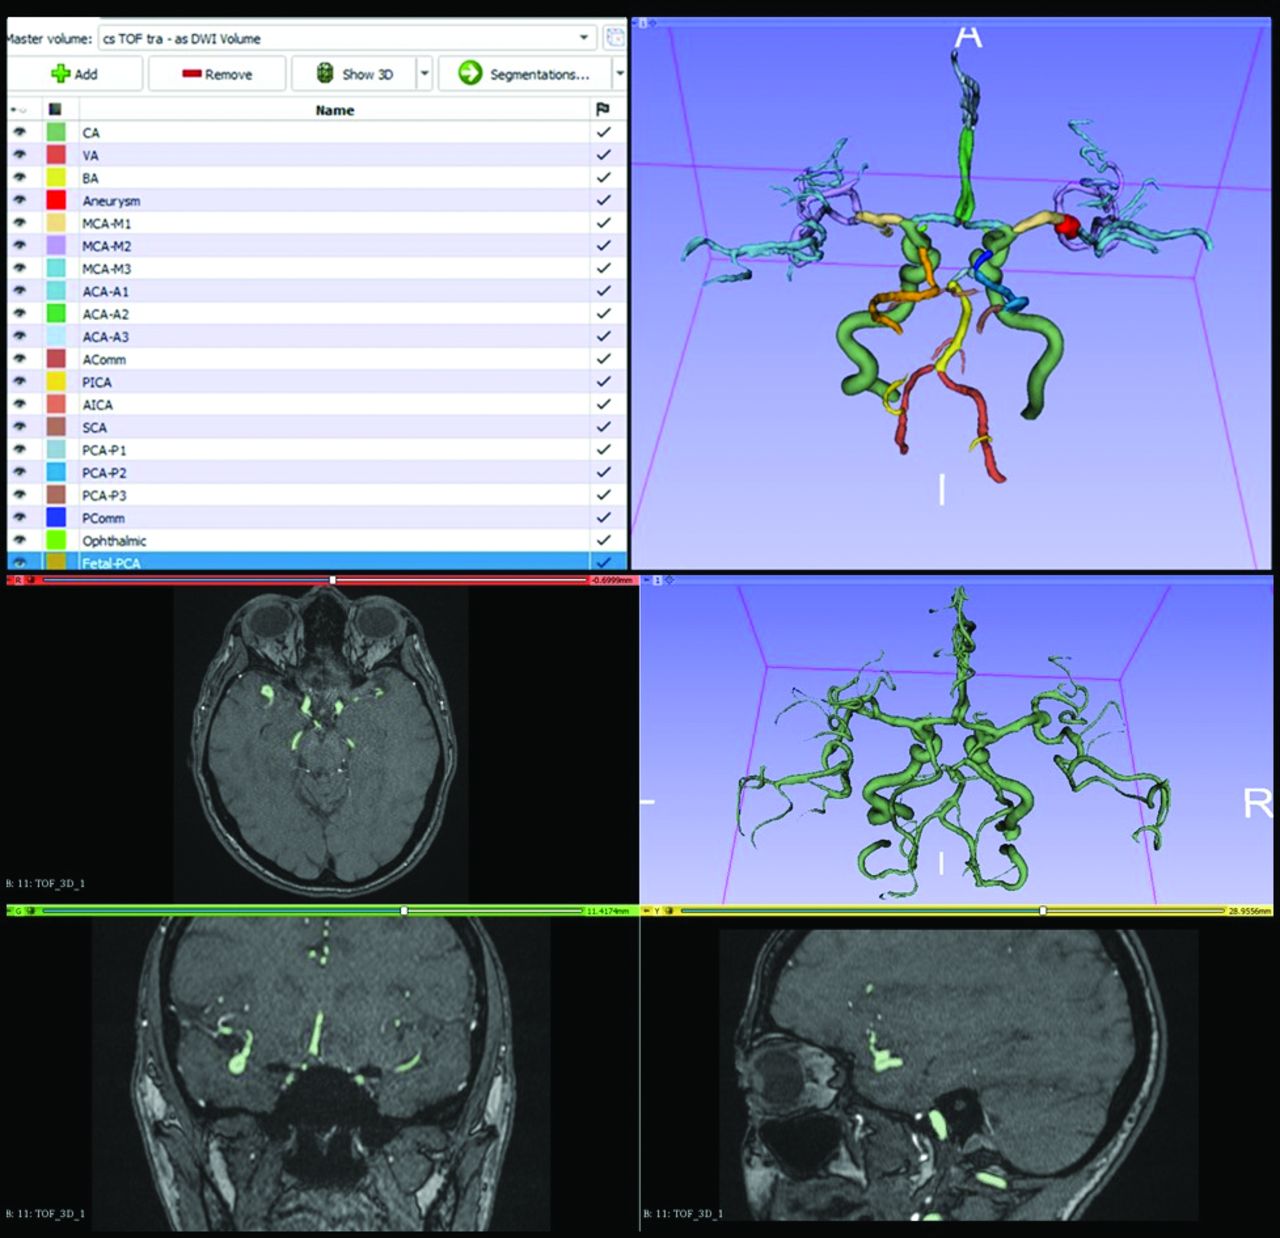
The manual segmentation of all data was performed with open-source software 3D Slicer8 (https://www.slicer.org/). After initial segmentation of the whole vascular tree by using thresholding, each arterial territory was manually labeled. The manual labeling achieved the segmentation of all major intracranial arteries up to the third division of the anterior cerebral artery (ACA), MCA, and PCA. The segmentations were cleaned up by removing any distinct islands smaller than 20 voxels with a connected component analysis to remove noise from the thresholding step. Figure 3 provides an example segmentation. Table 1 provides an overview of the anatomic structures present in the data set and their frequency of appearance.
Model Training
The model was trained by using nnU-Net v2.0, with default settings. Architecture choices were automatically made based on data set features, such as median spacing.6 This trains the model for 1000 epochs, 250 steps per epoch, and a batch size of 2. To reduce the effects of data imbalance, patch sampling is biased toward containing foreground with a ratio of 2:1. Because we split off an independent test set, the 5-fold cross-validation was not utilized, and all available data in the train set was used during training instead. Training was performed on a system with a single Nvidia A100 40 GB, paired with 2 Xeon Silver 4316 CPUs (Intel) and 512 GB RAM.
Model Testing
After training, the resulting model was evaluated with the test data. The model generated a prediction for each patient, which then was compared with the manual segmentations by using the DSC, Centerline Dice (ClDice),9 and 95th percentile Hausdorff distance (HD95). Metric implementations for the DSC and HD95 were provided by MONAI v1.3,10 the ClDice implementation was retrieved from the official implementation.
Of 62 scans, only 2 contained all 21 classes (Table 1). In the context of the nnUNet algorithm, a “class” refers to a distinct category or label that the model is trained to recognize during the segmentation process. Classes are defined based on the specific problem domain and the desired outcomes. A check was performed to assess whether an empty prediction for a certain class matched the absence of the associated structure in the ground truth. If an empty prediction was matched to a nonempty ground truth, the scores were set to 0.0 and infinity values for DSC and ClDice, and HD95, respectively. The infinity values were filtered out of the analyses for final analyses. An overview of the nn-Unet inference pipeline is provided in Figure 2.

Overview of the nnU-Net inference pipeline from start to finish. Each distinct pipeline section is marked separately. Not visualized are the steps required to load the image and model into memory, or write the segmentation to disc.

A screenshot taken directly from 3D Slicer showing an example segmentation visualized in 3D (upper right), with the associated labels and colors (upper left), and the preparatory work by using the MRA-TOF (lower).
Aneurysm Detection
Assessing whether the model could be used as a detection tool for aneurysms was evaluated by manually checking whether each aneurysm in the ground truth had an overlapping predicted aneurysm. Furthermore, a postprocessing of the segmentations removing any distinct island below 1 mm3 from all classes was added. For this, we collected true-positive (TP), false-positive (FP), and false-negative (FN) predictions values on a per-aneurysm basis. To decouple the segmentation quality from the detection, any overlapping voxel of a prediction with a ground truth aneurysm segmentation was counted as a TP. Each FP and FN detection was manually verified. The sensitivity and precision were calculated.
Timing
To compare the nnU-Net to manual segmentation workflows, we assessed the time required to generate a segmentation for each patient in the test set. For the purpose of measuring a wider range of images, all available cases in both the train and test sets were used to create a prediction and the time from start to end logged. Predictions from this experiment were not used in segmentation performance analyses. The entire pipeline was included in the time measurement, not just the time necessary for the model to create a prediction. That is, the time required to prepare the model, read the data, perform any postprocessing and write the result to memory was measured. To reduce any potential interference from background processes these measurements were run 5 times by using the same hardware used for training.
RESULTS
Vessel Segmentation Performance
Across all classes, the median DSC was 0.86 [95% CI: 0.81–0.89], the median ClDice was 0.91 [0.85, 0.94], and the median HD95 was 2.8 [1.0, 14.9] mm (Fig 4). Regarding only the arteries, the median DSC was 0.86 [0.80, 0.89], the median ClDice was 0.91 [0.85, 0.94], and the median HD95 was 2.9 [1.0, 15] mm. The best performing classes among the arterial structures proved to be the carotid artery and basilar artery (BA), respectively, with a median DSC of 0.96 [0.91, 0.97] and 0.86 [0.74, 0.92]. On the other hand, the segmented arteries featuring the worst performance were the fetal PCA and the anterior choroidal artery, with a median DSC of 0.0 [0.0, 0.32] and 0.0 [0.0, 0.691], respectively.

Overview of the nnU-Net scores. A, The DSC and ClDice, displayed for all classes, all classes without aneurysm, and the individual class scores, respectively. B, The HD95, for all classes, all classes without aneurysm, and the individual class scores, respectively. C, The performance versus the class volume. All metrics have a regression line fit, with the bands indicating a 95% CI for the fit. Note that the HD95 is visualized with a logarithmic y-axis displayed on the right-hand side. Both plots use a logarithmic x-axis.
Aneurysm Recognition and Segmentation Performance
Thirteen imaging studies and 17 IAs formed the subgroup of cases included in the test set. Of these, 7 were MCA-IAs, 4 were ICA-IAs, 3 were AComm-IAs, 2 were PComm-IAs, and 1 was an aneurysm of the BA. Median aneurysm volume was 100.5 mm3 [12.40, 660.0]. For the aneurysm segmentations, a median DSC of 0.85 [0.073, 0.927] and median HD95 of 2.33 [0.39, 114.5] mm were found. Assessing the detection of aneurysms indicated a TP rate of 0.9, a FP rate of 0.25, and a FN rate of 0.1. These rates amounted to a sensitivity of 0.9 and a precision of 0.78.
Best and Worst Performing Cases
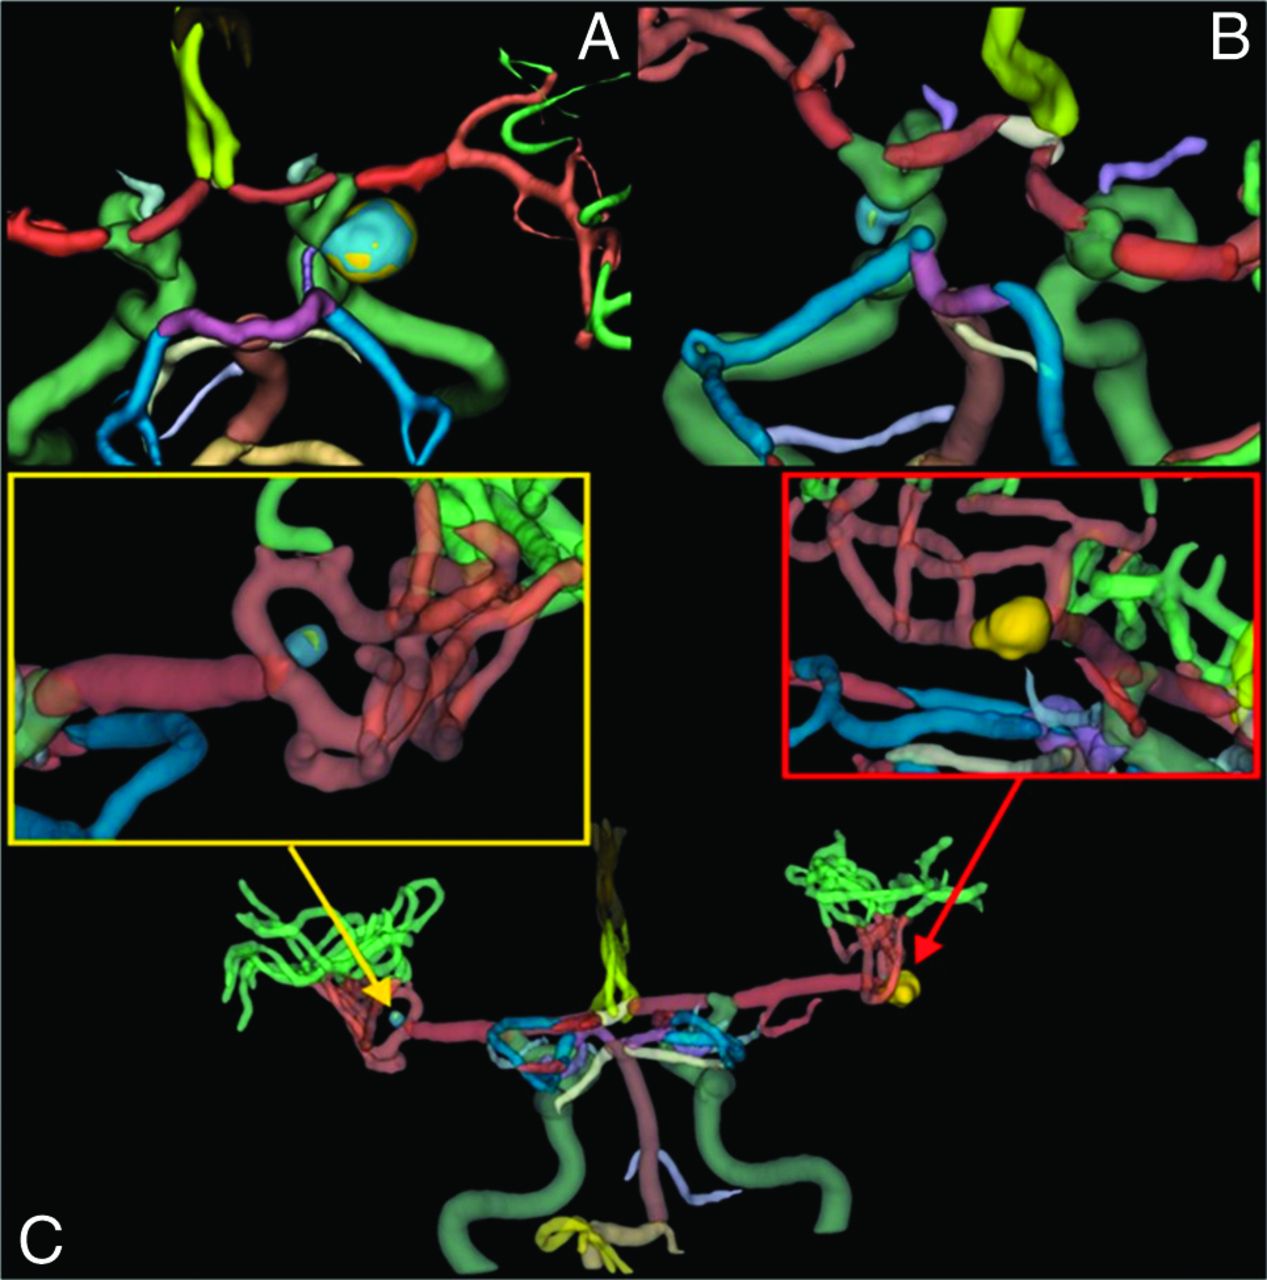
The very best and worst performing cases of the test set as far as IA identification were selected to provide a more detailed idea of the potentiality of the developed algorithm. The best performing case was an aneurysm of the apex of the ICA and showed a DSC of 0.94, whereas the worst performing IA was a PComm aneurysm with a DSC of 0.010. The explanation of the performance scores could be attributed respectively to the high and low representation of ICA- and PComm-IAs in the included cohort (Fig 5A, -B). A notable case with multiple IAs (mirror MCA bifurcation aneurysms) showed a DSC of 0.84 resulting from the combination of an adequately predicted right MCA-IA and a poorly predicted left MCA-IA (Fig 5C).

Best (A) and worst (B) performing cases as far as identification of the IA. C, In blue the ground truth aneurysm, whereas in yellow the predicted aneurysm. For anatomic reference, the ICA is in dark green.
Time
Average time for manual labeling of a 3D MRA-TOF was 90 minutes. The median time to generate a prediction, including reading and writing, was 130.6 [60.9, 284.1] seconds. A longer median prediction time was necessary for larger scan volumes, which is explained by the patch-based nature of nnU-Net, causing larger images to require more individual predictions (Fig 6).

Comparison of image volume with the time to create a prediction. Due to the patch-based nature of nnU-Net, larger images require more individual predictions, which corresponds with total prediction time. The reported scan volumes are those before any preprocessing or foreground cropping. The coloring of the clusters of dots indicate the same patient. Vertical and horizontal lines are used to indicate the median value, and their 95% CI bounds.
DISCUSSION
This paper presents implementation of a nnU-Net based pipeline for automatic segmentation of the cerebrovascular tree including IAs from MRA-TOF data. The performance of this neural network proved to be good across several realistic cases.
While a number of authors also tried to develop an automatic, fast, and accurate segmentation of IAs based on data sets of 3D MRA-TOF scans (Table 2), the presented algorithm may provide possible advantages over prior published attempts (ADAM 2020 Challenge, https://adam.isi.uu.nl/).11
First, the presented algorithm differs from earlier ones by targeting the segmentation of both IAs and the most significant intracranial vessels. This provides a more comprehensive overview for clinical applications. Second, with a median DSC of 0.86 and a median ClDice of 0.91 across all segmented classes, our algorithm’s performance is acceptable for medical image segmentation. Specifically, for aneurysms, we achieved a median DSC of 0.85 and a sensitivity of 0.8, indicating strong performance compared with previous efforts. The effectiveness of the presented algorithm can be attributed to its nnU-Net-based segmentation of vascular intracranial structures, which effectively utilizes the complexity and dimensionality of the imaging data while understanding voxel spacing, leading to satisfactory outcomes. Additionally, the algorithm operates entirely automatically, requiring no user input, which eliminates variability in the workflow. This method proved also faster than manual segmentation, thus reducing the cumbersome and labor-intensive nature of this process. Furthermore, it uses standard ML strategies and standard imaging scans for algorithm development, tools that are widely available in many scientific and medical institutions. This allows for further optimization of its performance.
Importantly, our algorithm is designed for future integration into a cloud-based platform, enabling visualization with MxR glasses. We hypothesize that this feature will enhance surgeon-imaging interaction and support surgical planning. Furthermore, the possibility of this integration will represent a distinctive aspect that will set our algorithm apart from previous approaches.
Limitations
The present study has limitations. First, the model was trained solely on images harboring IAs, therefore, if applied to segment scans without IAs, it would intrinsically present a chance of FPs for IAs detection. However, during training the model was fed patches that did not overlap with an aneurysm, thus it was not certain that the model would represent an aneurysm. Further experimentation with scans without IAs should indicate whether this represents a large issue. Moreover, the number of cases included in the independent training set was only 13, limiting the generalizability of the results. Furthermore, this model was trained solely on MRA-TOFs. Therefore, its performance is not generalizable to other imaging modalities, such as a contrast-enhanced T1 scan. Additionally, while the data set does include scans from MRI machines different to the ones utilized in the third referral center, where the cases were collected and analyzed, there may be a risk that the model will not work as well on a new, unseen MRI scanner model. However, retraining the model to work properly in these new settings may only require a small amount of new representational data from the new clinical center to be added to the original data set to regain full performance.19 A further limiting factor affecting the performance of the algorithm is the relatively low representation of certain anatomic structures in the data set, ie, anterior choroidal artery. To achieve a more precise automatic recognition of less represented structures, future training sets will have to focus on including more of these anatomic entities.
Indeed another identifiable drawback is represented by the lack of a thorough strategy to avoid interobserver variability in the making of the annotations. Nonetheless, each scan was annotated by an experienced neurosurgical resident with specific training on 3D imaging processing and further validated by a senior neurosurgeon with more than 15 years of experience in vascular neurosurgery.
A further major limitation of the study is the lack of clinical and/or demographic data pertaining to the cases included in the analysis. If on one hand this lack may decrease the generalizability of the implementation of the nnUNet, on the other hand it helps to ensure the complete anonymization of the data.
Another limitation of the study is intrinsic to the used performance metrics. Because of the nature of the DSC, smaller structures tended to perform worse (Fig 4C). A misclassification of few voxels in a small structure represents a bigger error than the same amount of misclassified voxels in a larger structure.20 Due to this, DSC lacks sensitivity to small FP segmentations. Moreover, our qualitative analysis revealed that most errors in the arterial segments were due to discrepancies in defining the start and end points of each segment, rather than misclassifications of the vessel wall. Evidence for this could be observed in metrics for the combined arterial class. To that end, the ClDice and HD95 were also measured, which could complement the weaknesses of the DSC metric. For example, a high HD95 value, paired with a good DSC indicates that a model generates small FPs.
Furthermore, multiplicity of aneurysms influenced the overall volume of segmentation improving the performance. On the other hand, location and morphologic features of the analyzed structures did not affect segmentation performance. As far as the data set is concerned, a wider heterogeneity of the included aneurysms could improve the strength of the model in future training sessions.
Application of the Results and Future Perspectives
The application of the current algorithm in the clinical setting may provide clinicians with patient-specific 3D models of IAs for pretherapeutic 3D imaging study and surgical planning. With a median time of 2 minutes per prediction, a fast clinical incorporation of the presented algorithm may be feasible. While the measured times are heavily hardware dependent, even lower-end consumer grade hardware will be able to generate predictions much faster, thus supporting significantly the pretherapeutic management. To mitigate risk further, the algorithm could be used in a semiautomatic segmentation pipeline, where a clinician could correct any mistakes that may affect the surgical planning. The resulting 3D segmentation can be visualized on screen, on 3D screen, or even in stereoscopic heads up displays. Furthermore, after further successful validation of the algorithm with different imaging devices, it could potentially be used as a diagnostic adjunct. Future research should be focused on the development of improved algorithms for fast and precise automatic recognition of ruptured IAs, and algorithms integrating aneurysm-specific hemodynamic parameters, that could be implemented to predict the best aneurysm-specific treatment strategy (ie, watchful waiting, endovascular, surgical, or hybrid). Indeed, in the future the application of the presented algorithm should also be tested on a dedicated Mixed Reality system providing surgeons with patient-specific, interactive, and 3D holographic reconstructions of the IAs and their parent vessels for tailored treatment planning.
CONCLUSIONS
The nnUNet MRA-TOF based adequate algorithm provided a fast and automatic extraction of unruptured IAs, their parent vessels, and the most relevant cerebral arteries. Future steps involve the expansion of the training set with the inclusion of more MRA-TOF studies with and without IAs and its incorporation in 3D imaging viewers and treatment prediction.
Footnotes
Elisa Colombo and Mathijs de Boer contributed equally to this article.
Elisa Colombo was funded partially by the SURGENT project (UZH - Hochschulmedizin Zürich). Mathijs de Boer was funded by the Hanarth foundation (The Hague, The Netherlands).
Disclosure forms provided by the authors are available with the full text and PDF of this article at www.ajnr.org.
References
- 1.
- 2.
- 3.
- 4.
- 5.
- 6.
- 7.
- 8.
- 9.
- 10.
- 11.
- 12.
- 13.
- 14.
- 15.
- 16.
- 17.
- 18.
- 19.
- 20.
- Received July 11, 2024.
- Accepted after revision October 29, 2024.
- © 2025 by American Journal of Neuroradiology