Graphical Abstract

Abstract
BACKGROUND AND PURPOSE: Arterial spin-labeling (ASL) MRI has gained recognition as a quantitative perfusion imaging method for managing patients with brain tumors. Limited studies have so far investigated the reproducibility of ASL-derived perfusion in these patients. This study aimed to evaluate intrasession repeatability and intersession reproducibility of perfusion measurements using 3D pseudocontinuous ASL (pCASL) with TSE Cartesian acquisition with spiral profile reordering (TSE-CASPR) in healthy volunteers (HV) and patients with glioblastoma (GBM) at 3T and to compare them against 3D pCASL with gradient and spin echo (GRASE).
MATERIALS AND METHODS: This prospective study (NCT03922984) was approved by the institutional review board, and written informed consent was obtained from all subjects. HV underwent repeat pCASL evaluations 2–4 weeks apart between November 2021 and October 2022. Patients with GBM were recruited for longitudinal MRI from September 2019 to February 2023. Intrasession repeatability (HV and GBM) and intersession reproducibility (HV only) of pCASL were assessed using linear regression, Bland–Altman analyses, the intraclass correlation coefficient (ICC) with 95% CI, and within-subject coefficients of variation (wsCV).
RESULTS: Twenty HV (9 men; mean age, 25.1 [SD, 1.7] years; range, 23–30 years) and 21 patients with GBM (15 men; mean age, 59.8 [SD, 14.3] years; range, 28–81 years) were enrolled. In imaging sessions, 3D pCASL-measured perfusion with TSE-CASPR and GRASE, respectively, achieved high R2 values (0.88–0.95; 0.93–0.96), minimal biases (−0.46−0.81; −0.08−0.35 mL/100 g/min), high ICCs [95% CI], 0.96–0.98 [0.94–0.98]; 0.96–0.98 [0.92–0.99]), and low wsCV (6.64%−9.07%; 5.20%−8.16%) in HV (n = 20) and patients with GBM (n = 21). Across imaging sessions, 3D pCASL in HV (n = 20) achieved high R2 values (0.71; 0.82), minimal biases (−1.2; −0.90 mL/100 g/min), high ICC [95% CI] values (0.85 [0.81–0.89]; 0.90 [0.87–0.93]), and low wsCV values (13.82%; 9.98%).
CONCLUSIONS: Our study demonstrated excellent intrasession repeatability of 3D pCASL-measured cerebral perfusion in HV and patients with GBM and good-to-excellent intersession reproducibility in HV. 3D pCASL with GRASE performed slightly better than 3D pCASL with TSE-CASPR in HV; however, in patients with GBM, 3D pCASL with TSE-CASPR showed better performance in tumor regions with a nearly 2-fold higher SNR. ASL-measured perfusion could serve as a noncontrast quantitative imaging biomarker to facilitate the management of patients with GBM.
ABBREVIATIONS:
- ASL
- arterial spin-labeling
- CASPR
- Cartesian acquisition with spiral profile reordering
- GBM
- glioblastoma
- GRASE
- gradient and spin echo
- HV
- healthy volunteers
- ICC
- intraclass correlation coefficient
- M0
- proton-density-weighted image
- NSA
- number of signals averaged
- pCASL
- pseudocontinuous arterial spin-labeling
- PLD
- postlabel delay
- QI
- quantitative imaging
- wsCV
- within-subject coefficients of variation
SUMMARY
PREVIOUS LITERATURE:
Previous studies have demonstrated the value of ASL-measured perfusion in various neurologic conditions, showing the potential for clinical use. While many studies have reported reliable and reproducible ASL perfusion measurements in healthy subjects, there has been a scarcity of such research in patient populations. Some studies have shown notable intrasession repeatability and moderate test-retest reproducibility of ASL in elderly patients with mild cognitive impairment and Alzheimer disease. Nonetheless, studies that systematically investigated the reproducibility of ASL-measured perfusion in patients with brain tumors have been limited.
KEY FINDINGS:
In imaging sessions in HV (n = 20) and patients with GBM (n = 21) and across imaging sessions in HV (n = 20), 3D pCASL-measured perfusion with TSE-CASPR and GRASE achieved high R2 values, minimal biases, high ICCs, and low wsCV.
KNOWLEDGE ADVANCEMENT:
3D pCASL with GRASE performed slightly better than 3D pCASL with TSE-CASPR in HV. In patients with GBM, however, 3D pCASL with TSE-CASPR showed better performance in tumor regions with nearly 2-fold higher SNR, bolstering 3D pCASL with TSE-CASPR as a quantitative noncontrast perfusion imaging biomarker in brain tumors.
The use of quantitative imaging (QI) in radiology is gaining popularity for its improved precision in diagnosis, prognosis, and evaluating the therapy response.1 QI provides objective measurements, aiding in identifying subtle and sometimes qualitatively imperceptible changes in disease conditions. QI enables the correlation of accurately and precisely derived image metrics with relevant anatomic and physiologic parameters, encompassing treatment effects and patient outcomes. A critical factor for the clinical adoption of QI is the demonstration of consistent repeatability and reproducibility of QI metrics, not only in healthy individuals but also in patient populations.
QI has shown significant promise in evaluating the response to treatment in cancers.2 Conventional radiologic methods, such as the Response Evaluation Criteria in Solid Tumors (RECIST)3 or the modified Response Assessment in Neuro-Oncology,4,5 primarily focus on changes in measuring tumor size. However, these conventional techniques may not detect early therapy responses, because many cancer treatments initially affect tumors at a microscopic level before any significant change in size becomes evident. QI techniques can identify these early effects, providing a valuable window of opportunity to effectively manage cancer treatments. Notably, angiogenesis, a key biologic process that promotes aberrant tumor neovascularization,6 is emerging as a vital perfusion imaging biomarker. Among all perfusion-weighted imaging techniques, arterial spin-labeling (ASL) MR imaging7,8 has certain advantages. ASL MRI is a noncontrast and noninvasive imaging method that provides absolute quantitative measures of perfusion, proved to be especially valuable in brain imaging.
On the basis of the recommendations from the ASL expert panel of the International Society for Magnetic Resonance in Medicine, the early clinical adoption of ASL used 3D segmented acquisition techniques like 3D stack-of-spirals with multiple refocusing pulses or 3D gradient and spin-echo (GRASE) for brain imaging.9 Both acquisition methods, however, tend to have image distortions in regions with increased B0 inhomogeneities.10 This issue is particularly pertinent in patients with glioblastoma (GBM), an aggressive brain tumor, especially those who have undergone craniotomy, those with pre- or posttreatment intratumoral hemorrhage, and those with tumors located close to the skull base. To address this issue, alternate methods were developed using 3D TSE Cartesian acquisition with pseudocontinuous arterial spin-labeling (pCASL) for robust noncontrast perfusion imaging with minimized image distortions.11⇓-13 The purpose of this study was to evaluate intrasession repeatability and intersession reproducibility of perfusion measurements using 3D pCASL with Cartesian TSE in healthy volunteers (HV) and patients with GBM at 3T and compare them against 3D pCASL with GRASE.
MATERIALS AND METHODS
Participants
This prospective, single-institution study (ClinicalTrials.gov Identifier: NCT03922984) was approved by the institutional review board, and written informed consent was obtained before subject participation in the study. Twenty subjects who had no contraindications to standard MRI were enrolled between November 2021 and October 2022 as the healthy volunteer (HV) cohort (Table 1). Subjects with pregnancy or any history of neurologic or psychiatric diseases were excluded. Twenty-one subjects with GBM were enrolled between September 2019 and February 2023 as part the clinical study in the GBM study cohort (Table 1). The inclusion criteria were histologically proved GBM; no prior treatment such as chemotherapy, radiation treatment, or anti-angiogenic therapy except for surgery; and planned receipt of chemoradiation therapy. Because this is a repeatability and reproducibility study performed using repeat measurements at multiple visits, the methodology proposed in the Strengthening the Reporting of Observational Studies in Epidemiology (STROBE) checklist was followed.
Demographic characteristics of HV and patients with GBM included in the study analysis
MR Imaging Protocol
All imaging was performed on a 3T MR scanner (Ingenia; Philips Healthcare) using a 32-channel head coil. All HV were scanned twice with intersession time intervals of 2–4 weeks (Fig 1A, upper row), matching the interval between the first 2 MRI time points of patients with GBM (Fig 1A, lower row). For each visit, 2 imaging sessions were performed with a 15-minute break between sessions (Supplemental Data). In each imaging session, 2 runs of 3D pCASL with TSE using Cartesian acquisition with spiral profile reordering (CASPR)11 and 2 runs of 3D pCASL with GRASE were performed. Patients with GBM were enrolled for longitudinal MR scans before, during, and after chemoradiation treatment, according to the clinical study (Fig 1A, lower row). Each imaging session for patients with GBM followed the recommended brain tumor imaging protocol,14 with additional sequences including 2 runs of 3D pCASL with TSE-CASPR and at least 1 run of 3D pCASL with GRASE (Supplemental Data). All ASL acquisitions were performed before the administration of a gadolinium-based contrast agent.

MR scan timelines and postprocessing analysis pipelines for both HV and patients with glioblastoma. A, MR scan timelines. Upper row: Each healthy volunteer participated in 2 visits (V1 and V2) with a time interval of 2–4 weeks. At each visit, there were 2 imaging sessions (S1 and S2) with a 15-minute break. Two runs (R1 and R2) of 3D pCASL with TSE-CASPR and 2 runs of 3D pCASL with GRASE were obtained in each imaging session with the imaging protocol shown in the Supplemental Data. Lower row: Each patient with GBM participated in longitudinal MRI performed before (T0), during (T3, T6), and after (T10, T18, T26, T34) chemoradiation treatment; the number after “T” represents the number of weeks from the beginning of treatment. T3 and T6 had a ±1 week range, while T10–T34 had ±2 weeks range. In addition to the standard clinical protocol for GBM, MRI was performed with 2 runs of 3D pCASL with TSE-CASPR and at least 1 run of 3D pCASL with GRASE, as shown in the Supplemental Data. B, ASL postprocessing pipeline. DICOM images were first converted to NIfTI format. ASL difference images and M0 images were skull-stripped for brain extraction, followed by coregistration to the SRI24 atlas and CBF map calculation. Segmentations of gray matter, white matter, and regional ROIs from the SRI24 atlas were used to extract CBF measurements in HV. C, Structural MR postprocessing pipeline. For patients with GBM, the ASL postprocessing pipeline was the same as in HV (B). All structural MR images were coregistered to 3D T1 postcontrast images, and manual tumor ROIs were drawn by an experienced neuroradiologist (M.C.P.), followed by coregistration to the SRI24 atlas for tumor and normal-appearing gray and white matter ROI extraction.
ASL labeling was applied in an axial plane perpendicular to the cervical spine C2 to C3 area with label duration and postlabel delay (PLD) of 1.8 seconds each. A combination of several saturation and inversion pulses was used for background suppression followed by spatially selective inflow saturation to reduce the postlabeled arterial signal in the major vessels. 3D pCASL with TSE-CASPR was acquired in an axial plane with the following parameters: field of view = 220 × 220 × 110 mm3, matrix = 64 × 64 with 42 slices, acquired resolution = 3.5 × 3.5 × 6 mm3, reconstructed resolution = 3 × 3 × 3 mm3, TR/TE = 6000/14 ms, echo spacing = 2.8 ms, TSE factor = 80, shot duration = 235 ms, number of signals averaged (NSA) = 1, and acquisition time = 3 minute 10 seconds. A proton-density-weighted image (M0) was acquired using the same acquisition parameters but without labeling, background suppression, or inflow saturation pulses in 1 minute 30 seconds. For comparison, ASL images were also acquired using the vendor-supplied 3D pCASL with GRASE, matching the same acquisition parameters as in 3D pCASL with TSE-CASPR, except for TR/TE = 3955/14 ms, echo spacing = 14.1 ms, TSE factor = 19, EPI factor = 15, shot duration = 268 ms, NSA = 3, and acquisition time = 4 minute 37 seconds (including the M0). Both 3D pCASL with TSE-CASPR and 3D pCASL with GRASE had similar acquisition times of ∼4 minute 40 seconds, including M0.
Image Analysis
For HV, the entire ASL processing pipeline included format conversion from DICOM to NIfTI format with dcm2nii (https://www.nitrc.org/projects/dcm2nii/),15 followed by skull-stripping using the brain extraction tool in FSL http://fsl.fmrib.ox.ac.uk/fsl/fslwiki/BET)16⇓-18 and coregistration to the SRI24 structural atlas19 by ANTS (http://stnava.github.io/ANTs/) (Fig 1B).20 After alignment, ASL CBF maps were calculated using the single-compartment model according to the following equation:9
 where ΔM is the signal intensity of the perfusion difference image; λ is the blood-brain partition coefficient (0.9); T1 is the longitudinal relaxation time of blood (1600 ms); PLD of 1800 ms; labeling delay (LD) of 1800 ms; α is the net labeling efficiency of 0.6 including background suppression.11,21 Perfusion measurements were then extracted from the gray matter, white matter, and regional ROIs on the basis of the SRI24 atlas (https://www.nitrc.org/projects/sri24/).
For patients with GBM, all images were first coregistered to T1 postcontrast images (Fig 1C). The T1 pre- and postcontrast images were then normalized on the basis of the signal intensity histogram22 and subtracted to generate δ T1 images. By means of the structural T2, T2-FLAIR, T1-pre, and δ T1 images, ROIs of the tumor characteristics were manually drawn by an experienced neuroradiologist (M.C.P.), including enhancing tumor, tumor core, whole-tumor, necrosis, resection cavity, cyst, and hemorrhage. Subsequently, all nonbaseline images including ASL, M0, and corresponding tumor ROIs were coregistered to the baseline MR images using ANTS. The CBF values from the tumor ROIs and the normal-appearing brain ROIs (by excluding the tumor ROIs) were extracted. The mean (SD) of CBF values in mL/100 g/min was tabulated.
Statistical Analysis
All statistical analyses were performed with GraphPad Prism (GraphPad Software). The normality of mean perfusion values was tested using the D’Agostino-Pearson test, Anderson-Darling test, Shapiro-Wilk test, and the Kolmogorov-Smirnov test. A paired t test was performed to evaluate the difference between mean perfusion values from 3D pCASL with TSE-CASPR and 3D pCASL with GRASE. The reproducibility was measured using linear regression, Bland-Altman analyses, and intraclass correlation coefficients (ICCs). ICC estimates and their 95% CIs were calculated using the SPSS statistical package (IBM) based on a single-measurement, absolute-agreement, and the 2-way mixed effects model. Within-subject coefficients of variation (wsCV), defined as the ratio of the SD of the difference between repeat measurements to the mean of the repeated measurements, were also computed. The SNR was calculated in HV using dual acquisitions (R1 and R2), according to the National Electrical Manufacturers Association (NEMA) methodology:23

RESULTS
HV
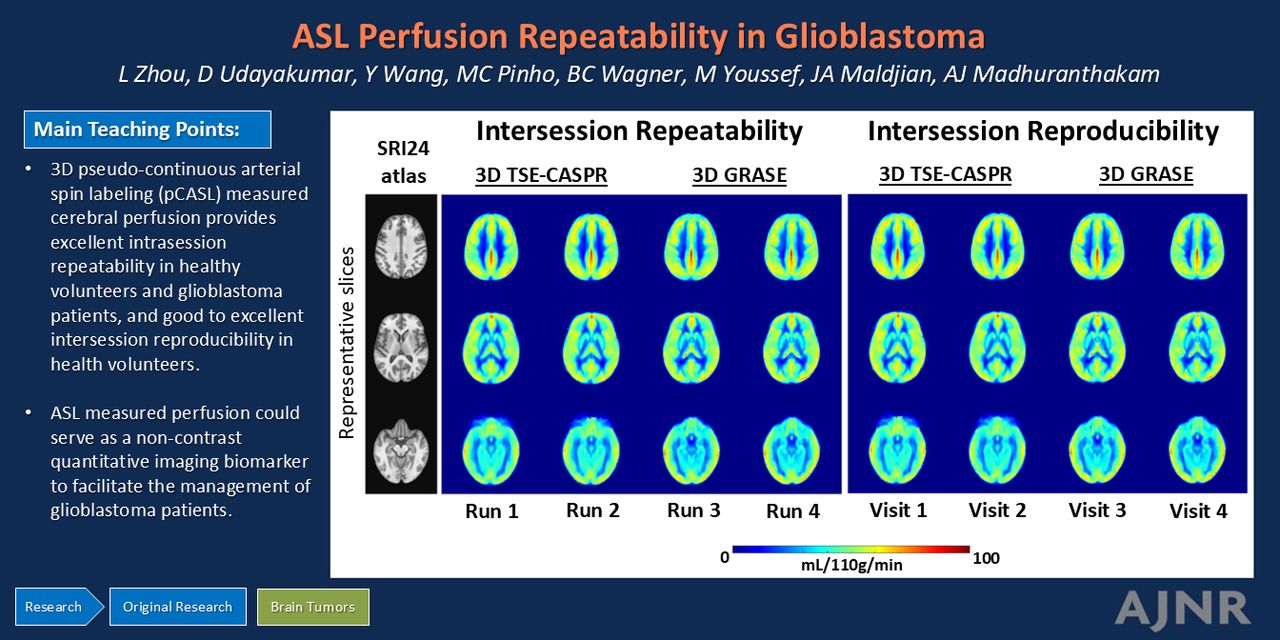
ASL perfusion maps were successfully acquired in all 20 HV. Each healthy volunteer underwent 2 MR visits (V1, V2) with 4 imaging sessions (V1S1, V1S2, V2S1, and V2S2) for a total of 80 imaging sessions. Within each imaging session, 2 runs (R1, R2) of 3D pCASL with TSE-CASPR and 2 runs of 3D pCASL with GRASE were performed (Fig 1A, upper row). The average perfusion maps across all 20 HV acquired at run 1 within each imaging session (ie, V1S1R1, V1S2R1, V2S1R1, and V2S2R1) and at run 2 within each imaging session (ie, V1S1R2, V1S2R2, V2S1R2, and V2S2R2) showed good coregistration and similar perfusion values, demonstrating qualitative intrasession repeatability for both 3D pCASL with TSE-CASPR and 3D pCASL with GRASE (Fig 2, left). Similarly, the average perfusion maps across all 20 HV acquired at visit 1 (ie, V1S1R1, V1S1R2, V1S2R1, and V1S2R2) and at visit 2 (ie, V2S1R1, V2S1R2, V2S2R1, and V2S2R2) demonstrated qualitative intersession reproducibility for both readouts (Fig 2, right).

Coregistration between ASL-measured perfusion maps and standard SRI24 atlas qualitatively shows good intrasession repeatability and intersession reproducibility in HV. Representative slices of averaged perfusion maps among 20 HV and the corresponding SRI24 T1-weighted atlas slice for intrasession (left) and intersession (right) comparisons between 2 runs of 3D TSE-CASPR and 3D GRASE readouts. The unit of perfusion values is mL/100 g/min.
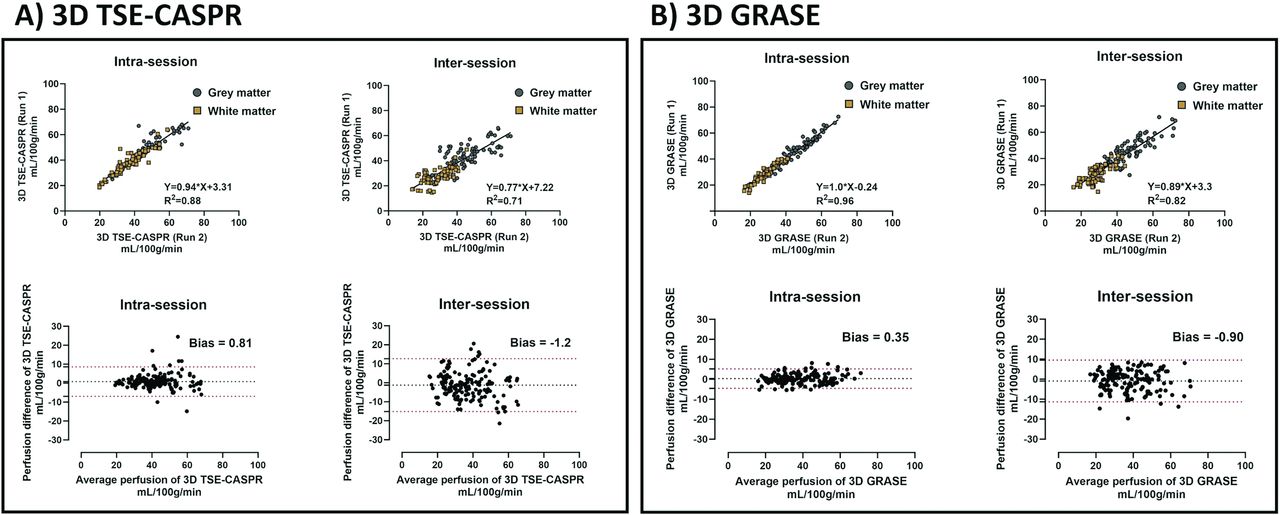
Quantitative analyses also showed similar results for both 3D pCASL with TSE-CASPR (Fig 3A) and 3D pCASL with GRASE (Fig 3B), evaluated using linear regression (upper row) and Bland-Altman analyses (lower row). The intrasession repeatability measures of 3D pCASL with TSE-CASPR were the following: slope (95% CI) of 0.94 (0.89–1.0), R2 value of 0.88, ICC (95% CI) of 0.96 (0.94–0.97), wsCV of 7.21%, and a minimal bias of 0.81 mL/100 g/min (Fig 3A and Tables 2 and 3). The corresponding intrasession repeatability measures of 3D pCASL with GRASE were the following: slope (95% CI) of 1.02 (0.98–1.05), R2 value of 0.96, ICC (95% CI) of 0.97 (0.96–0.98), wsCV of 5.2%, and a minimal bias of 0.35 mL/100 g/min (Fig 3B and Tables 2 and 3). Overall, 3D pCASL with both readouts showed excellent intrasession repeatability, with 3D GRASE performing slightly better than 3D TSE-CASPR.

Quantitative analyses show good intrasession repeatability and intersession reproducibility of ASL-measured perfusion in HV. Linear regression (upper row) and Bland-Altman analyses (lower row) in HV. Mean perfusion values (mL/100 g/min) in gray matter and white matter, measured using 3D pCASL with TSE-CASPR (left, A) and 3D pCASL with GRASE (right, B), were used for intrasession and intersession reproducibility evaluations.
Statistical analyses demonstrate intrasession repeatability and intersession reproducibility of CBF measurements in HV
Intra Class Correlation (ICC) shows excellent intrasession repeatability and intersession reproducibility of CBF measurements in HV
The intersession reproducibility measures of 3D pCASL with TSE-CASPR were the following: slope (95% CI) of 0.78 (0.70–0.85), R2 value of 0.71, ICC (95% CI) of 0.85 (0.81–0.89), wsCV of 13.82%, and a minimal bias of −1.2 mL/100 g/min (Fig 3A and Tables 2 and 3). The corresponding intersession reproducibility measures of 3D pCASL with GRASE were the following: slope (95% CI) of 0.89 (0.82–0.96), R2 value of 0.82, ICC (95% CI) of 0.90 (0.87–0.93), wsCV of 9.98%, and a minimal bias of −0.9 mL/100 g/min (Fig 3B and Tables 2 and 3). The intersession reproducibility was good to excellent for 3D pCASL with both readouts with 3D GRASE performing better than 3D TSE-CASPR. Similar behavior of good-to-excellent intrasession reliability was observed by both readouts at regional ROI levels, while the intersession reproducibility was moderate (Supplemental Data).
The CBF measurements from both readouts showed normal distributions across all HV (P > .05 for all 4 normality tests). The paired t test for mean CBF values showed no significant differences between the 2 readouts (Supplemental Data), for both intrasession repeatability (P = .91) and intersession reproducibility (P = .32).
Patients with GBM
Representative slices of perfusion maps covering the tumor along with corresponding structural MR images for 1 representative patient with GBM are shown in Fig 4 at multiple time points. All images demonstrated good coregistration across different timepoints. The patients with GBM were all treated with chemoradiation, which results in the adverse effect of global brain perfusion reduction over the duration of the therapy.24,25 Hence, we limited our evaluation to only intrasession repeatability in patients with GBM.

Significant reduction of global cerebral perfusion measurements in 1 patient with GBM following chemoradiation, demonstrated by longitudinal MR scans. Representative slices of perfusion maps and corresponding structural MR images (SRI24 atlas slice and δ T1) of a 71-year-old female patient with GBM, shown at different time points before (upper row, T0), during (middle row, T6) and after (lower row, T34) chemoradiation treatment. Two runs of 3D pCASL with TSE-CASPR were acquired for all 3 time points. Two runs of 3D pCASL with GRASE were performed for T0 and T6, while 1 run was performed at the T34 time point. The units of perfusion values are mL/100 g/min.
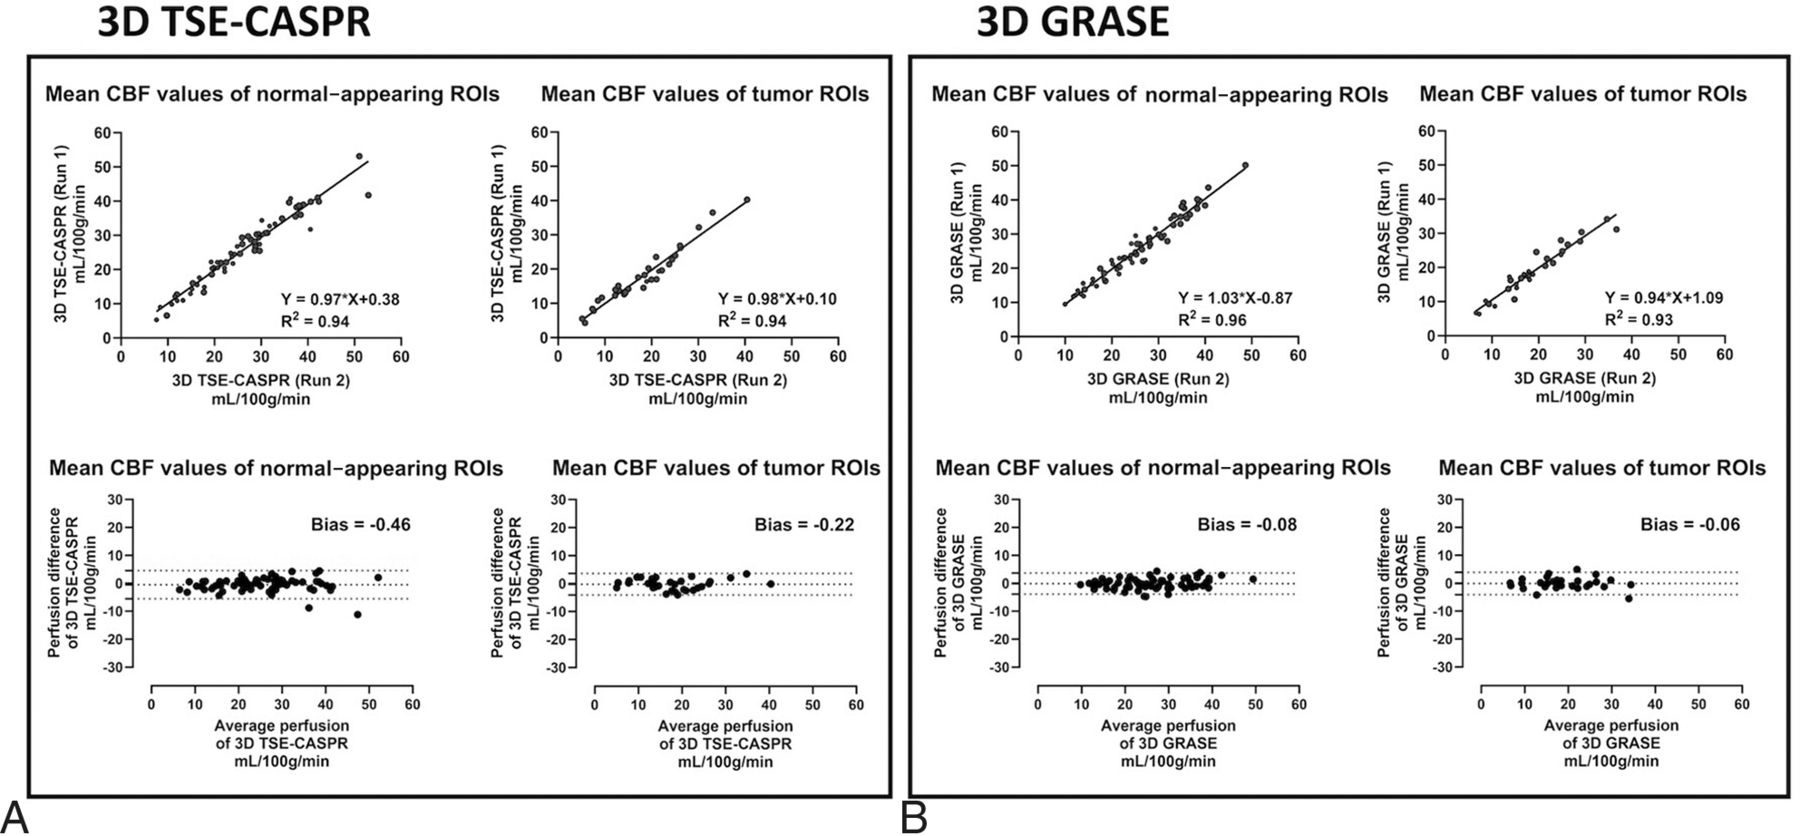
All 21 enrolled patients with GBM underwent 2 runs of 3D pCASL with TSE-CASPR for a total of 88 imaging sessions. Across all 88 imaging sessions, linear regression and Bland-Altman analyses revealed excellent intrasession repeatability in both normal-appearing brain regions (slope [95% CI] of 0.99 [0.95–1.02], R2 value of 0.95, ICC [95% CI] of 0.98 [0.97–0.98], wsCV of 6.64%, and a minimal bias of −0.35 mL/100 g/min) and in tumors (slope [95% CI] of 1.03 [0.97–1.09], R2 value of 0.94, ICC [95% CI] of 0.97 [0.95–0.98], wsCV of 8.56%, and a minimal bias of −0.03 mL/100 g/min) (Fig 5 and Tables 4 and 5). Among the 21 patients with GBM, 9 patients were also imaged with 2 runs of 3D pCASL with GRASE in addition to 2 runs of 3D pCASL with TSE-CASPR for a total of 32 imaging sessions. Hence, the intrasession repeatability comparison between the 2 readouts was performed in this subcohort analysis of 32 imaging sessions. Linear regression and Bland-Altman analyses revealed excellent intrasession repeatability for 3D pCASL with TSE-CASPR in both normal-appearing brain regions (slope [95% CI] of 0.97 [0.90–1.03], R2 value of 0.94, ICC [95% CI] of 0.97 [0.95–0.98], wsCV of 7.94%, and a minimal bias of −0.46 mL/100 g/min) and in tumors (slope [95% CI] of 0.98 [0.89–1.07], R2 value of 0.94, ICC [95% CI] of 0.97 [0.94–0.98], wsCV of 9.07%, and a minimal bias of −0.22 mL/100 g/min) (Fig 6A and Tables 4 and 5). The corresponding intrasession repeatability for 3D pCASL with GRASE was also excellent in both normal-appearing brain regions (slope [95% CI)] of 1.03 [0.95–1.10], R2 value of 0.96, ICC [95% CI] of 0.98 [0.96–0.99], wsCV of 5.55%, and a minimal bias of −0.08 mL/100 g/min) and in tumors (slope [95% CI)] of 0.94 [0.84–1.04], R2 value of 0.93, ICC [95% CI] of 0.96 [0.92–0.98], wsCV of 8.16%, and a minimal bias of −0.06 mL/100 g/min) (Fig 6B and Tables 4 and 5). Overall, the intrasession repeatability in patients with GBM was excellent with both readouts in normal-appearing brain regions, while the performance of 3D TSE-CASPR was slightly better in tumors compared with 3D GRASE.

Quantitative analyses show good intrasession repeatability in tumor ROIs and normal-appearing brain ROIs, for measured perfusion using 3D pCASL with TSE-CASPR among 21 patients with GBM across 88 imaging sessions. Linear regression and Bland-Altman analyses were performed in patients with GBM. Mean perfusion values (mL/100 g/min) in tumor ROIs (left) and normal-appearing gray and white matter (right), measured using 3D pCASL with TSE-CASPR, were used to evaluate the intrasession reproducibility of ASL.

Comparison of quantitative analyses for ASL-measured perfusion between 3D pCASL with TSE-CASPR (A) and 3D pCASL with GRASE (B) among 9 patients across 32 imaging sessions. Results show good intrasession repeatability for both readouts in tumor ROIs and normal-appearing brain ROIs of patients with GBM. Linear regression and Bland-Altman analyses were performed in patients with GBM. Mean perfusion values (mL/100 g/min) in tumor ROIs (left) and normal-appearing gray and white matter (right), measured using 3D pCASL with TSE-CASPR and 3D pCASL with GRASE, were used to evaluate intrasession reproducibility of ASL.
Statistical analyses demonstrate intrasession repeatability of normal-appearing gray and white matter and tumors in patients with GBM
Intra Class Correlation (ICC) shows excellent intrasession repeatability of normal-appearing gray and white matter and tumors in patients with GBM
3D TSE-CASPR Has Higher SNR and Increased Robustness to Image Distortions Than 3D GRASE
Figure 7 demonstrated the comparative image quality of perfusion maps acquired using 3D pCASL with TSE-CASPR and 3D pCASL with GRASE. In HV, both readouts generated comparable quality perfusion maps without substantial image distortions, as evident from the overlay on the anatomic T2-weighted images (Fig 7A). However, in patients with GBM, 3D TSE-CASPR provided more robust image quality and reduced image distortions compared with 3D GRASE, particularly in areas with increased B0 inhomogeneities as observed near surgical craniotomy locations (Fig 7B). Similar behavior was also observed in HV near areas with increased B0 inhomogeneities such as in the caudate, where 3D TSE-CASPR outperformed 3D GRASE in terms of intrasession repeatability and intersession reproducibility (Supplemental Data). CBF maps generated by 3D TSE-CASPR also demonstrated better tumor-to-normal background tissue contrast (Fig 7B). Moreover, 3D TSE-CASPR had higher (∼2 folds) SNR compared with 3D GRASE in gray matter (mean, 6.31 [SD, 1.39] versus 3.54 [SD, 0.63], P < .0001) and white matter (6.37 [SD, 1.61] versus 3.54 [SD, 0.65], P < .0001) (Fig 7C).

3D TSE-CASPR has increased robustness to image distortions and higher SNR than 3D GRASE. A, Overlays of ASL images on T2-weighted structural images of a 25-year-old female healthy volunteer with 3D TSE-CASPR on the left and 3D GRASE on the right. B, Overlays of ASL images on T2-weighted structural images of a 56-year-old male patent with GBM with 3D TSE-CASPR on the left and 3D GRASE on the right. C, SNR values of ASL perfusion images using 3D pCASL with TSE-CASPR and 3D pCASL with GRASE, calculated with dual acquisitions across 20 HV.
DISCUSSION
ASL MRI has gained recognition as a QI method for the measurement of CBF, showing the potential for diagnosis, response assessment, and surveillance of patients with brain tumors. For QI methods to be reliably adopted in clinical practice, high precision is essential. Our study has demonstrated the excellent intrasession repeatability of 3D pCASL-measured CBF in both HV and patients with GBM, evidenced by high R2 values (TSE-CASPR: 0.88–0.95; GRASE: 0.93–0.96), minimal biases (TSE-CASPR: −0.46−0.81 mL/100 g/min; GRASE: −0.08−0.35 mL/100 g/min), high ICC [95% CI] values (TSE-CASPR: 0.96–0.98 [0.94–0.98]; GRASE: 0.96–0.98 [0.92–0.99]), and low wsCV values (TSE-CASPR: 6.64%−9.07%; GRASE: 5.20%−8.16%). Notably, this excellent repeatability was observed in both normal-appearing brain regions and tumor ROIs for both TSE-CASPR and GRASE. Additionally, our study established good-to-excellent intersession reproducibility in HV, as shown by high R2 values (TSE-CASPR: 0.71; GRASE: 0.82), minimal biases (TSE-CASPR: −1.2 mL/100 g/min; GRASE: −0.90 mL/100 g/min), high ICC [95% CI] values (TSE-CASPR: 0.85 [0.81–0.89]; GRASE: 0.90 [0.87–0.93]), and low wsCV values (TSE-CASPR: 13.82%; GRASE: 9.98%). These findings strongly support the clinical translation of ASL as a noncontrast, noninvasive, and quality-controlled QI method for managing patients with GBM.
Our data showed that 3D pCASL with GRASE performed slightly better than 3D pCASL with TSE CASPR for both intrasession repeatability and intersession reproducibility in HV. In patients with GBM, however, the performance of both readouts was equivalent in normal-appearing regions, while 3D pCASL with TSE-CASPR showed slightly better performance in tumor ROIs. Our protocol acquired 3D GRASE with 3 NSAs and 3D TSE-CASPR with 1 NSA, maintaining equivalent acquisition times for both sequences. The better performance of 3D GRASE in HV might be attributed to the averaging out of signal variations with increased NSAs. Conversely, 3D TSE-CASPR exhibited nearly 2-fold higher SNR, enhanced contrast between tumor and background tissue, improved robustness to B0 inhomogeneity, and fewer artifacts compared with 3D GRASE. These benefits likely contributed to the superior repeatability of 3D TSE-CASPR in patients with GBM, particularly in tumor ROIs. Moreover, the increased resilience of 3D TSE-CASPR to image distortions allows precise coregistration of CBF maps to structural images such as T1, T2, and T2-FLAIR (eg, Fig 7B). This facilitates accurate tumor perfusion measurement using automated segmentations that are often performed using structural images. These advancements bring ASL closer to routine clinical use.
Previous studies have demonstrated that ASL can provide valuable perfusion information in various neurologic conditions, showing the potential for clinical use.26,27 However, a significant hurdle has been the difficulty in achieving consistent ASL-measured perfusion across different subjects and time for the same subjects, hindering its clinical adoption. While many studies have reported reliable and reproducible ASL perfusion measurements in healthy subjects,28,29 there has been a scarcity of such research in patient populations. Some studies have shown notable intrasession repeatability and moderate test-retest reproducibility of ASL in elderly patients with mild cognitive impairment and Alzheimer disease.30,31 Nonetheless, studies that systematically investigated the reproducibility of ASL-measured perfusion in patients with brain tumors have been limited. Zhou et al32 have demonstrated high intrasession repeatability of pCASL-measured perfusion in a small group of patients with GBM, focusing on normal-appearing gray matter and tumor regions. Next, Alsaedi et al33 have shown high repeatability for both pulsed ASL and pCASL for the assessment of perfusion parameters in a cohort of adult patients with gliomas. Our study corroborates these findings, showcasing high intrasession repeatability and intersession reproducibility of pCASL-measured perfusion in both HV and a larger group of patients with GBM at multiple time points.
This study has several limitations. First, our HV were relatively young (23–30 years of age) compared with patients with GBM (28–81 years of age). Although major differences in the reproducibility of pCASL are not expected due to age, minor variations could still occur. Future studies will aim to align the age ranges of HV with those of patients with GBM to better facilitate clinical applicability. Second, pCASL sequences were acquired with a single PLD due to the shorter scan time, ease of acquisition, postprocessing, and clinical implementation. This single PLD may not be sufficient for accurate CBF quantification, especially in the elderly who may exhibit longer arterial transit times, including patients with GBM. Nevertheless, arterial transit times are unlikely to change significantly within a single imaging session, thus not affecting intrasession repeatability. Similarly, arterial transit time variations in HV are not anticipated during short intervals (∼3 weeks) and hence would not affect intersession reproducibility. Future studies will explore the repeatability of 3D pCASL with multiple PLDs. Last, we did not assess intersession reproducibility in patients with GBM due to the potential effects of chemoradiation therapy on normal brain regions. Future studies will consider normalization techniques and relative CBF measurements, like relative CBV metrics used routinely in DSC imaging for brain tumors.34
CONCLUSIONS
Our study demonstrated excellent intrasession repeatability of 3D pCASL-measured cerebral perfusion in both HV and patients with GBM, along with good-to-excellent intersession reproducibility in HV. Our study also demonstrated that 3D pCASL with GRASE performed slightly better than 3D pCASL with TSE-CASPR in HV. In patients with GBM, however, 3D pCASL with TSE-CASPR showed better performance in tumor regions with a nearly 2-fold higher SNR. These findings bolster the potential of noncontrast, noninvasive, and quality-controlled ASL-measured perfusion, particularly using 3D pCASL with TSE-CASPR as a QI biomarker in brain tumors. The application of ASL in clinical settings can aid in the diagnosis, prognosis, and longitudinal assessment of treatment responses in managing patients with GBM.
Acknowledgments
The authors thank all volunteers and patients with GBM for their time and consenting to participate in this study. The authors also thank Kelli Key, PhD, Michael Fulkerson, AS, LVN, Sydney Haldeman, MPH, and Camille Harry, BS, for their assistance with the institutional review board and human subject recruitments and Abey Thomas, RT(MR), and Courtney Dawson, RT(MR), for their assistance in human imaging.
Footnotes
Dr Wang is currently affiliated with Bayer, Guangzhou, China.
This work was supported by National Institutes of Health/National Cancer Institute grants U01CA207091, R01CA260705.
Disclosure forms provided by the authors are available with the full text and PDF of this article at www.ajnr.org.
References
- 1.
- 2.
- 3.
- 4.
- 5.
- 6.
- 7.
- 8.
- 9.
- 10.
- 11.
- 12.
- 13.
- 14.
- 15.
- 16.
- 17.
- 18.
- 19.
- 20.
- 21.
- 22.
- 23.
- 24.
- 25.
- 26.
- 27.
- 28.
- 29.
- 30.
- 31.
- 32.
- 33.
- 34.
- Received August 16, 2024.
- Accepted after revision October 21, 2024.
- © 2025 by American Journal of Neuroradiology