Abstract
BACKGROUND AND PURPOSE: DSC-MR imaging can be used to generate fractional tumor burden (FTB) maps via application of relative CBV thresholds to spatially differentiate glioblastoma recurrence from posttreatment radiation effects (PTRE). Image-localized histopathology was previously used to validate FTB maps derived from a reference DSC-MR imaging protocol by using preload, a moderate flip angle (MFA, 60°), and postprocessing leakage correction. Recently, a DSC-MR imaging protocol with a low flip angle (LFA, 30°) with no preload was shown to provide leakage-corrected relative CBV (rCBV) equivalent to the reference protocol. This study aimed to identify the rCBV thresholds for the LFA protocol that generate the most accurate FTB maps, concordant with those obtained from the reference MFA protocol.
MATERIALS AND METHODS: Fifty-two patients with grade-IV glioblastoma who had prior surgical resection and received chemotherapy and radiation therapy were included in the study. Two sets of DSC-MR imaging data were collected sequentially first by using LFA protocol with no preload, which served as the preload for the subsequent MFA protocol. Standardized relative CBV maps (sRCBV) were obtained for each patient and coregistered with the anatomic postcontrast T1-weighted images. The reference MFA-based FTB maps were computed by using previously published sRCBV thresholds (1.0 and 1.56). A receiver operating characteristics (ROC) analysis was conducted to identify the optimal, voxelwise LFA sRCBV thresholds, and the sensitivity, specificity, and accuracy of the LFA-based FTB maps were computed with respect to the MFA-based reference.
RESULTS: The mean sRCBV values of tumors across patients exhibited strong agreement (concordance correlation coefficient = 0.99) between the 2 protocols. Using the ROC analysis, the optimal lower LFA threshold that accurately distinguishes PTRE from tumor recurrence was found to be 1.0 (sensitivity: 87.77%; specificity: 90.22%), equivalent to the ground truth. To identify aggressive tumor regions, the ROC analysis identified an upper LFA threshold of 1.37 (sensitivity: 90.87%; specificity: 91.10%) for the reference MFA threshold of 1.56.
CONCLUSIONS: For LFA-based FTB maps, an sRCBV threshold of 1.0 and 1.37 can differentiate PTRE from recurrent tumors. FTB maps aid in surgical planning, guiding pathologic diagnosis and treatment strategies in the recurrent setting. This study further confirms the reliability of single-dose LFA-based DSC-MR imaging.
ABBREVIATIONS:
- CCC
- concordance correlation coefficient
- FTB
- fractional tumor burden
- LFA
- low flip angle
- MFA
- moderate flip angle
- PTRE
- posttreatment radiation effects
- rCBV
- relative cerebral blood volume
- ROC
- receiver operating characteristic
- sRCBV
- standardized relative CBV
- WHO
- World Health Organization
SUMMARY
PREVIOUS LITERATURE:
CBV maps derived from a DSC-MR imaging protocol by using contrast agent preload, a moderate flip angle (60°), and postprocessing leakage correction have been well-validated through image-guided histopathology and are recommended for clinical use. Recently, computational and in vivo patient studies demonstrated that the use of a low flip angle (30°) without a preload produces sRCBV maps in strong agreement to the double-dose reference protocol. Fractional tumor burden maps, computed by applying sRCBV thresholds established by image-localized histopathology, enable reliable detection of regional tumor recurrence. This study aimed to identify the sRCBV thresholds for the LFA protocol.
KEY FINDINGS:
The mean and the voxelwise tumor sRCBV values between the LFA and MFA protocol exhibited strong agreement. An ROC analysis identified 2 sRCBV thresholds for the LFA protocol to reliably differentiate treatment effects from tumors (1.0) and to identify regions with a high probability of viable tumor cells (1.37).
KNOWLEDGE ADVANCEMENT:
FTB maps derived from the LFA protocol without the preload effectively distinguish between tumors and treatment effects, affirming the reliability of a single-dose LFA-based DSC-MR imaging protocol. Nevertheless, it is essential to validate these thresholds using histopathology to facilitate their utilization in clinical decision-making.
Glioblastoma is an aggressive brain tumor associated with a high degree of vascularity and malignancy. The standard treatment for glioblastoma includes surgical resection followed by radiation therapy and chemotherapy with temozolomide.1 Conventional MRI scans taken 3–6 months after treatment often show new regions of enhancement, indicating the disruption of the blood-brain barrier. This enhancement could be due to tumor recurrence or posttreatment radiation effects (PTRE). Because both tumor recurrence and PTRE have a similar visual appearance, conventional MRI scans are unable to reliably differentiate between the two.2⇓⇓-5 Distinguishing between PTRE and tumor recurrence is crucial because they require different treatment management because recurrence indicates treatment failure and PTRE signifies favorable treatment response, tumor stabilization, and better prognosis.6⇓⇓-9 Studies have demonstrated that advanced imaging techniques including perfusion-weighted and diffusion MRI, PET, and MRS have the capability to differentiate between tumors and PTRE.10⇓-12 Among these advanced imaging techniques, perfusion-weighted MRI has been found to be effective in differentiating tumor recurrence from PTRE.13⇓⇓⇓⇓-18
DSC-MR imaging is a perfusion-based MR imaging method that provides information about tissue hemodynamics and vasculature. The relative CBV (rCBV) derived from DSC-MR imaging is a useful noninvasive diagnostic tool that helps identify neoangiogenesis corresponding to high-grade glioma.14,15,19⇓⇓-22 Commonly, rCBV maps are normalized to a normal-appearing tissue ROI for ease of comparison across patients and time. More recently, this approach has been refined through standardization of rCBV maps (sRCBV). Unlike normalization, standardization translates the rCBV values to a standard intensity scale, removing the variability associated with user-dependent ROIs.23 This increases consistency and enables quantitative comparison across studies, making it an important step in optimizing workflow and achieving consensus methodology.24,25
Image-guided tissue histopathology and spatially matched rCBV data have been used to identify sRCBV thresholds that signify clinically relevant tissue states.24,26,27 A sRCBV threshold of 1.0 can be used to differentiate tumor recurrence (sRCBV >1.0) and PTRE (sRCBV <1.0).24,26,28 For regions with sRCBV >1.0, an upper threshold has been used to further distinguish the degree of tumor vascularity. In a recent study, sRCBV was spatially matched to diagnostic tissue samples, and it was determined that the probability of finding a viable tumor in voxels was 71% for sRCBV >1.0 based on receiver operating characteristic (ROC) analysis and 88% for sRCBV >1.56, which was the lower 95% CI level for glioblastoma tissue samples.27,29 The probability of tumor burden increases as the threshold increases. The application of these voxel-based thresholds to sRCBV maps enables generation of fractional tumor burden (FTB) maps defining 3 classes, containing colored voxels for each class: FTBlow (blue), percentage of voxels with sRCBV values <1.0; FTBmid (yellow), percentage of voxels with sRCBV values between 1.0 and 1.56; and FTBhigh (red), percentage of voxels with sRCBV >1.56.24,26,29,30 FTB maps provide a spatial depiction of regional tumor recurrence and PTRE, as these can often coexist in varying degrees within a single lesion. FTB maps could aid in surgical planning, pathologic diagnosis, and treatment planning in patients suspected of having recurrence.
Multiple studies have shown that DSC-MR imaging, when acquired and postprocessed using a standardized protocol, improves the correlation of rCBV with histopathology. This improvement bolsters the capability of differentiating tumors from PTRE, thereby influencing clinical decision-making.31⇓⇓⇓-35 The rCBV maps used for tissue validation were derived from the consensus-recommended DSC-MR imaging protocol by using a moderate flip angle (MFA, 65–75°), echo time (TE) 25–35 ms, repetition time (TR) < 1.5 seconds, full-dose contrast agent as preload, followed by a full-dose contrast agent for bolus injection and application of the Boxerman-Schmainda-Weisskoff postprocessing leakage correction method to minimize the confounding effects of contrast agent extravasation.33,36⇓-38 However, a second option was also included in the consensus recommendation. This option matches the protocol above except for the use of a low flip angle (LFA, 30°), a field-strength dependent TE (45 ms at 1.5T and 30 ms at 3T), and removal of the contrast agent preload. In a multisite validation study in patients with recurrent high-grade glioma, this single-dose option provided mean tumor sRCBV values that agreed with those derived from the double-dose protocol.39 The use of the single-dose, LFA protocol eliminates potential errors arising from variations in contrast agent incubation time and dosing. Although the mean tumor sRCBV values have been validated, there was a compelling need to establish the voxelwise LFA-based rCBV thresholds needed for reliable FTB mapping.
The objective of this study was to determine the sRCBV thresholds for the LFA protocol that produce FTB maps that best match those derived from the previously validated double-dose MFA protocol.
MATERIALS AND METHODS
Patients
The Dignity Health institutional review board approved this retrospective study. All data were acquired as part of clinical standard-of-care scans conducted between October 2018 and March 2020. Informed consent was obtained from patients who participated in this clinical investigation. Inclusion criteria were the presence of glioblastoma, isocitrate dehydrogenase wild-type, World Health Organization (WHO) grade 4 (based on the 2016 WHO Classification of CNS Tumors), patient age >18 years, availability of perfusion data sets for both LFA and MFA injections on the institutional PACS, and the presence of contrast-enhancing lesions on the scans. Patients with poor injection (n = 2) and missing dynamic data points (n = 4) were excluded. After applying these inclusion and exclusion criteria, a total of 52 patients were included in the analysis. All patients received chemotherapy and radiation therapy within 3–10 weeks after surgery or biopsy. The time between the end of radiation and the date of the perfusion scan ranged from 3 weeks to 8 years.
MR Imaging Protocol
All studies were performed at 3T (Signa HDxt, GE Healthcare). Using a gradient-echo sequence, the standard precontrast and postcontrast 3D anatomic T1-weighted images were obtained with the following parameters: TE: 2.7 ms, TR: 7.1 ms, acquisition matrix: 512 × 512, voxel size: 1.0 × 1.0 mm2, slice thickness: 2.0 mm, 212 axial slices, flip angle: 13°. The LFA DSC-MRI with no preload was acquired using a full-dose gadolinium-based contrast agent (gadobutrol, Gadavist) with the following scan parameters: TR: 1500 ms, TE: 30 ms, spatial resolution of 1.72 × 1.72 mm2 (acquisition matrix: 128 × 128), slice thickness of 5 mm (20 axial slices), and pixel bandwidth of approximately 4 kHz. This injection served as the preload for the subsequent double-dose MFA acquisition. After a delay of 6 minutes, a second full dose of gadolinium was administered, and the MFA DSC-MRI was acquired with identical acquisition parameters except for a flip angle of 60°.
Data Analysis
All imaging data were postprocessed using the commercially available, FDA-cleared OsiriX software plug-in IB Clinic. sRCBV maps were generated using IB Neuro (Imaging Biometrics, Version 21.12) by transforming the intensity histogram of each rCBV map into a standard histogram, and Boxerman-Schmainda-Weisskoff leakage correction was applied to minimize T1 and T2* leakage effects.23,38 The sRCBV maps were coregistered to the respective T1-weighted postcontrast images using IB Delta Suite (Imaging Biometrics, Version 21.05). A semi-automated analysis was performed using IB RadTech to determine the enhancing ROIs on ΔT1 (standardized postcontrast T1-weighted image – standardized precontrast T1-weighted image) maps for each individual patient.
Statistical Analysis
The concordance correlation coefficient (CCC) between the mean sRCBV derived from the LFA and MFA methods, and averaged across the entire 3D-enhancing ROI, was determined to evaluate agreement. Additionally, we also calculated the CCC for each subject between the 2 protocols. Using Matlab (MathWorks), reference FTB color class maps were computed from the MFA protocol with preload using the reference sRCBV thresholds 1.0 and 1.56. The optimum sRCBV thresholds for the LFA protocol were determined by performing 2 separate ROC analyses on voxelwise LFA-based sRCBV values. The analysis aimed to identify the thresholds that maximize the Youden index (sensitivity + specificity – 1), by incorporating inverse weighting based on each patient’s enhancing tumor volume, to address potential biases arising from variations in the ROI size. Thus, the application of these optimized thresholds yields single-dose, LFA-based FTB color class maps that best match those derived from the double-dose MFA reference protocol. Paired Wilcoxon signed rank tests were used to compare the sRCBV values between the LFA and MFA protocols. To compare the FTB maps between the 2 protocols, a Sørensen-Dice similarity coefficient was computed for each patient.
RESULTS
Fifty-two patients with grade-IV glioblastoma were included in the study, including 24 women and 28 men (average age of 60 years; SD = 13, range = 31–84).
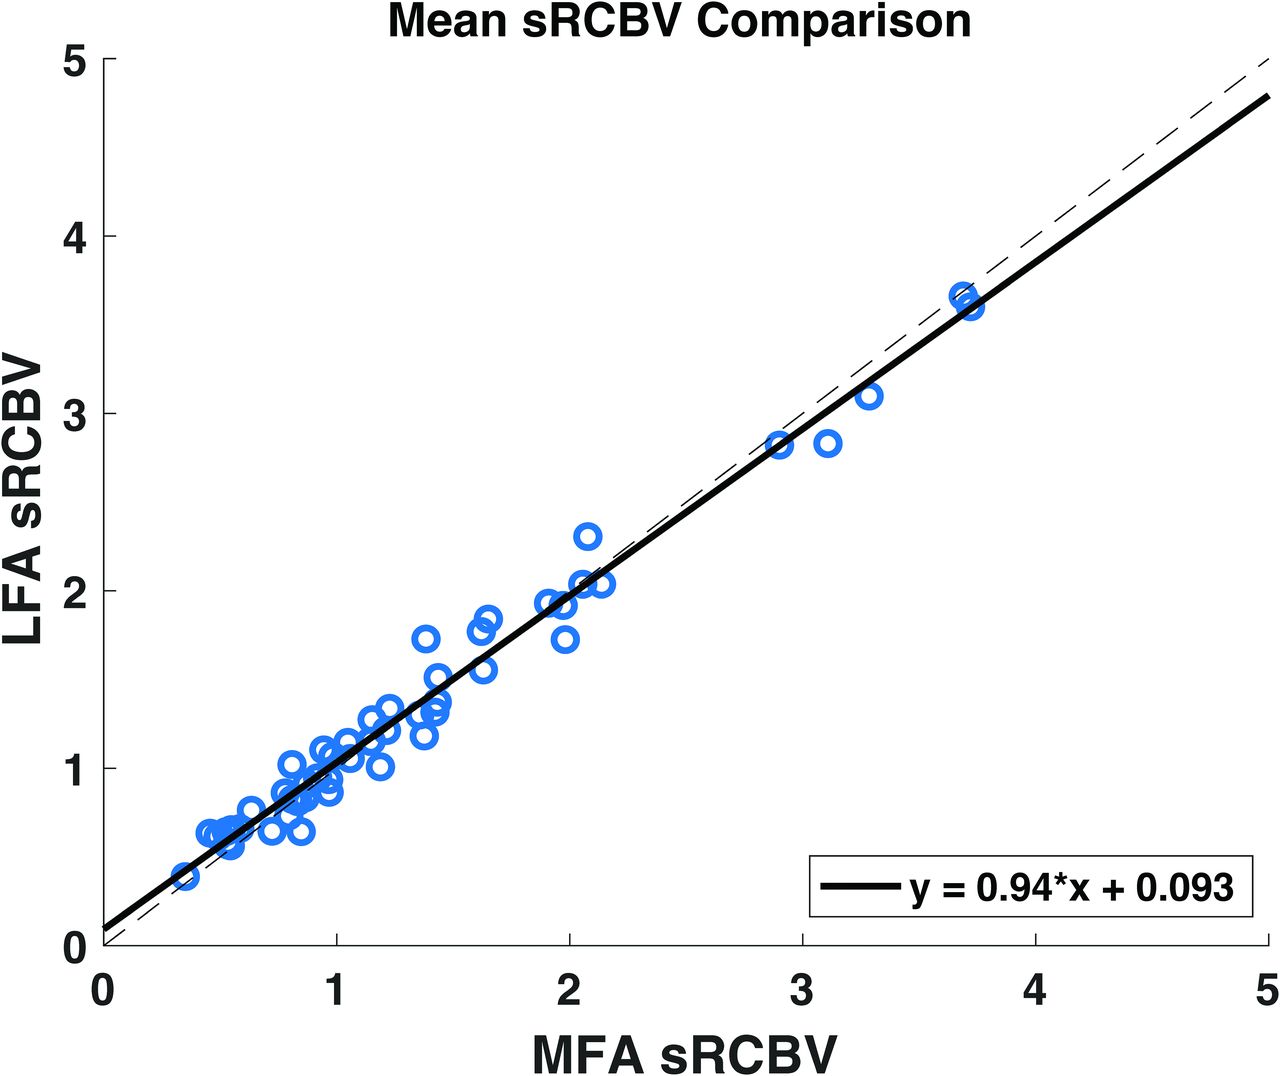
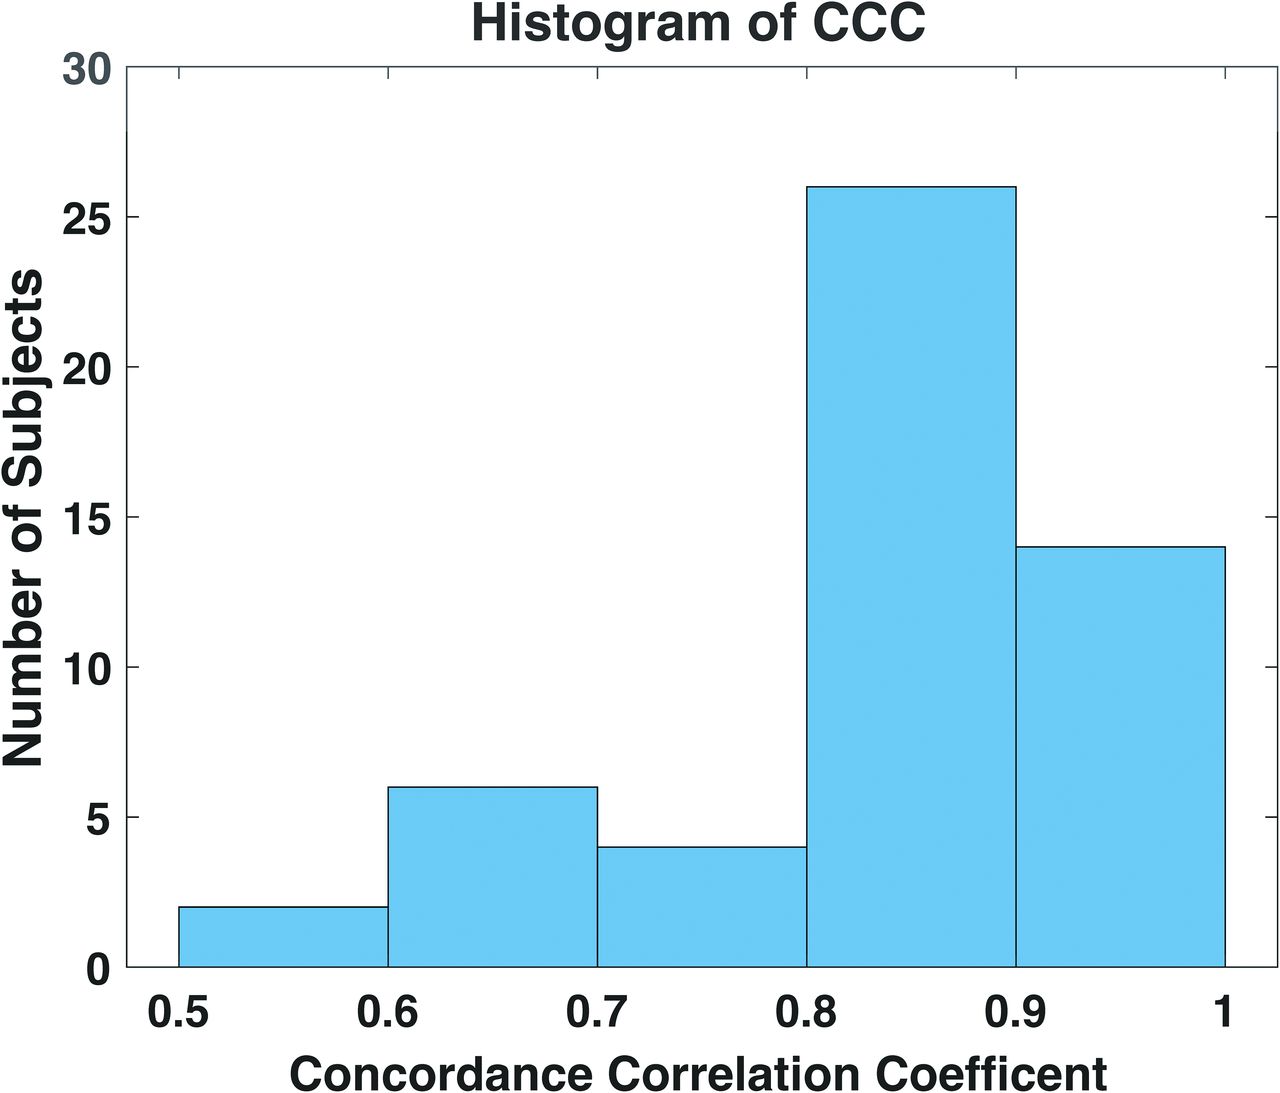
Figure 1 shows the correlation between the mean sRCBV from the no-preload, LFA protocol and that determined from the MFA protocol with preload. The mean sRCBV was determined from the average of all voxels within the contrast-enhancing ROI for both protocols. Figure 2 shows the histogram of the voxelwise CCC between the 2 protocols across all the patients, ranging from 0.52 to 0.96. A strong agreement between the 2 protocols is evident, with a CCC value of 0.98 for mean sRCBV, corroborating the prior, multisite study.39

A sRCBV comparison between the single-dose, LFA protocol and the double-dose, MFA protocol on the mean tumor ROI across all the patients (n = 52) included in the study. This result shows a strong agreement between the 2 protocols with a concordance correlation coefficient value of 0.99.

Histogram of CCC across each patient, ranging from 0.52 to 0.96. Seventy-seven percent of patients exhibit a CCC greater than 0.8.
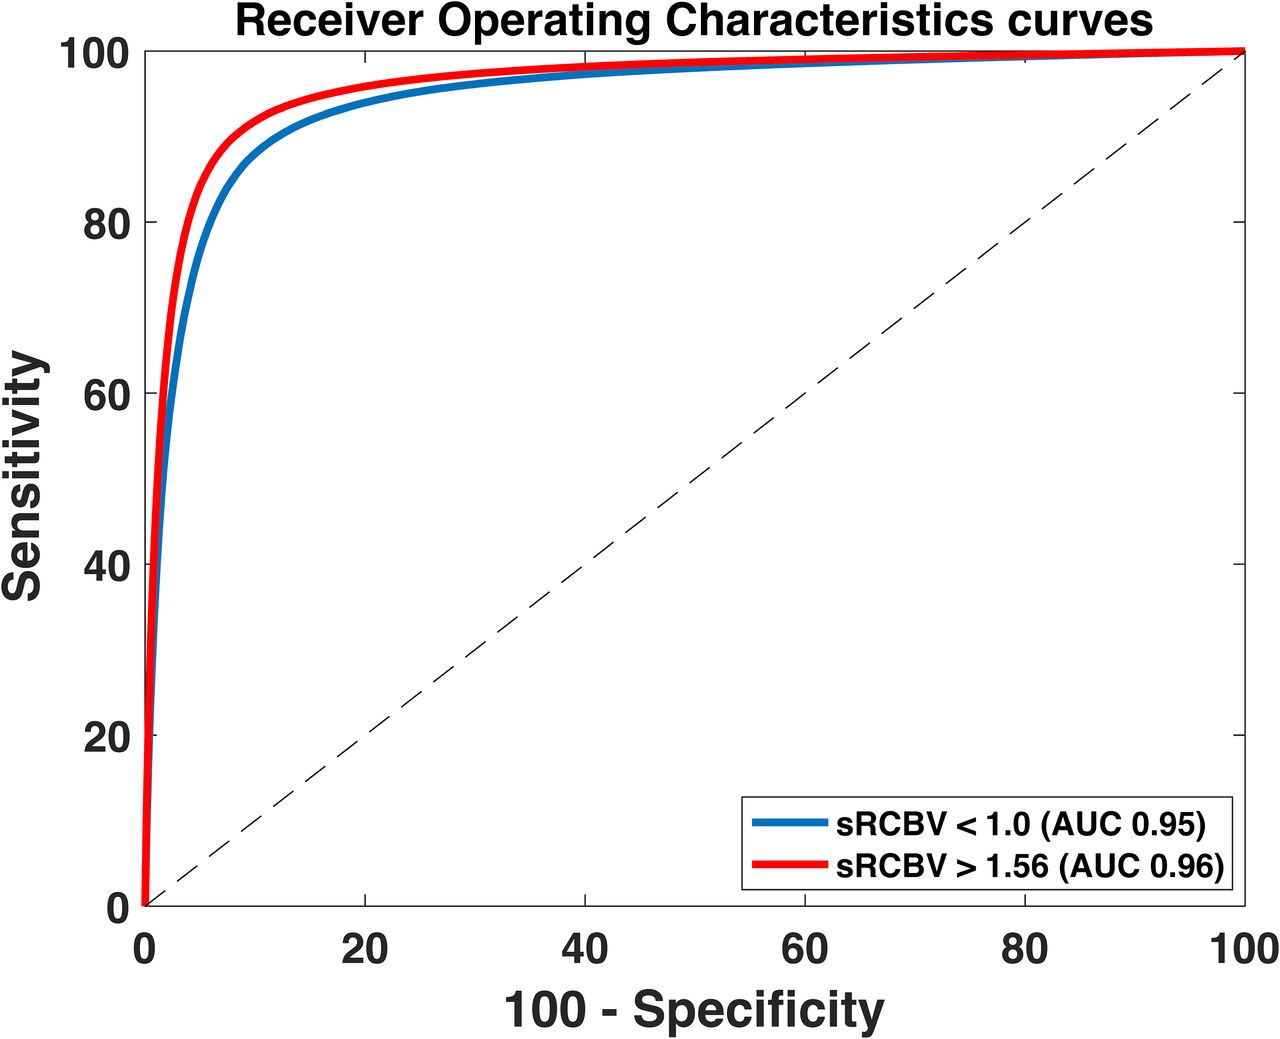
The optimal LFA thresholds for FTB mapping were identified through ROC analysis of voxelwise sRCBV values across all patients. In comparison with the MFA thresholds 1.0 and 1.56, the optimum LFA thresholds corresponding to the maximum Youden index were determined to be 1.0 and 1.37, respectively. The area under the ROCs for sRCBV <1.0 and sRCBV >1.56 were 0.95 and 0.96, respectively (Fig 3). A lower LFA threshold of 1.0 distinguished PTRE from tumors with sensitivity of 87.77% and specificity 90.22%.

The area under the ROC curve (AUC) for the optimal LFA-based thresholds is found to be 0.95 and 0.96 for sRCBV <1.0 and >1.56, respectively.
Prior studies have used 1.56 as the sRCBV upper reference threshold for the standard MFA protocol to identify aggressive tumor regions.27,29,30 In this study, an upper threshold of 1.37 was identified for the LFA protocol with sensitivity of 90.87% and specificity of 91.10%. As shown in Fig 4, the mean and standard deviation of the fractional tumor burden (ratio of the number of enhancing voxels with sRCBV >1 to the number of enhancing voxels) across all patients were 42.29% and 23.32% for MFA and 42.76% and 23.21% for LFA, respectively. Based on this figure, it can be inferred that every patient exhibited some degree of tumor recurrence in the standard double-dose MFA protocol, with a median value of 40.82% (min: 6.44%; max: 94.35%). Because the percentage of tumor voxels for both LFA and MFA were nonnormally distributed, as per a Shapiro-Wilk test, a paired Wilcoxon signed rank test (P = .36) revealed no statistically significant difference between LFA and MFA tumor voxels.

Boxplots (with individual datapoints) showing the consistency between percentage of tumor voxels (sRCBV >1.0) in the enhancing tumor for the double-dose, MFA and single-dose, LFA protocols.
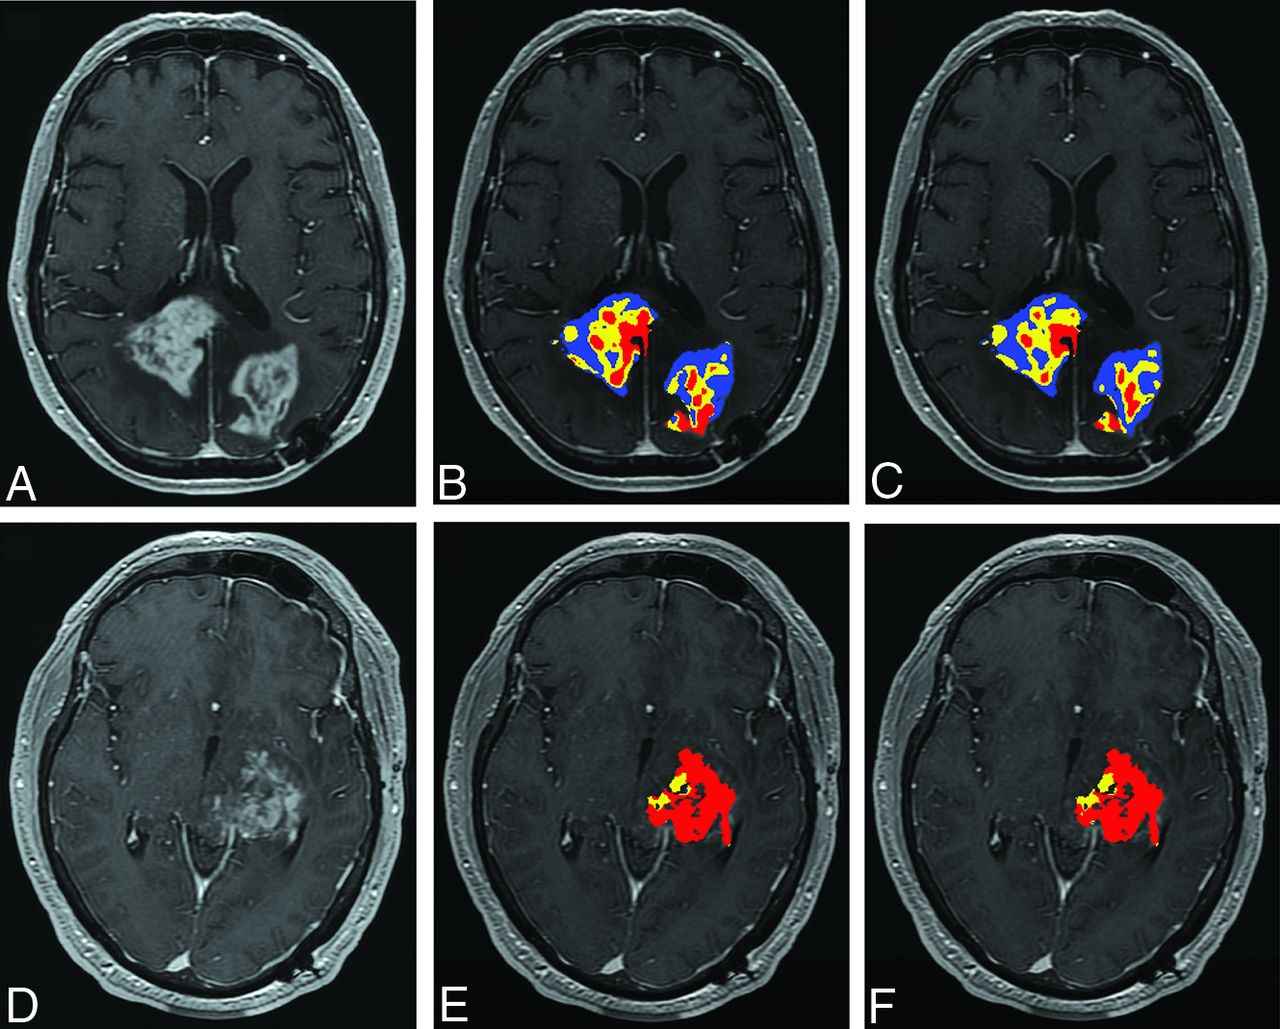
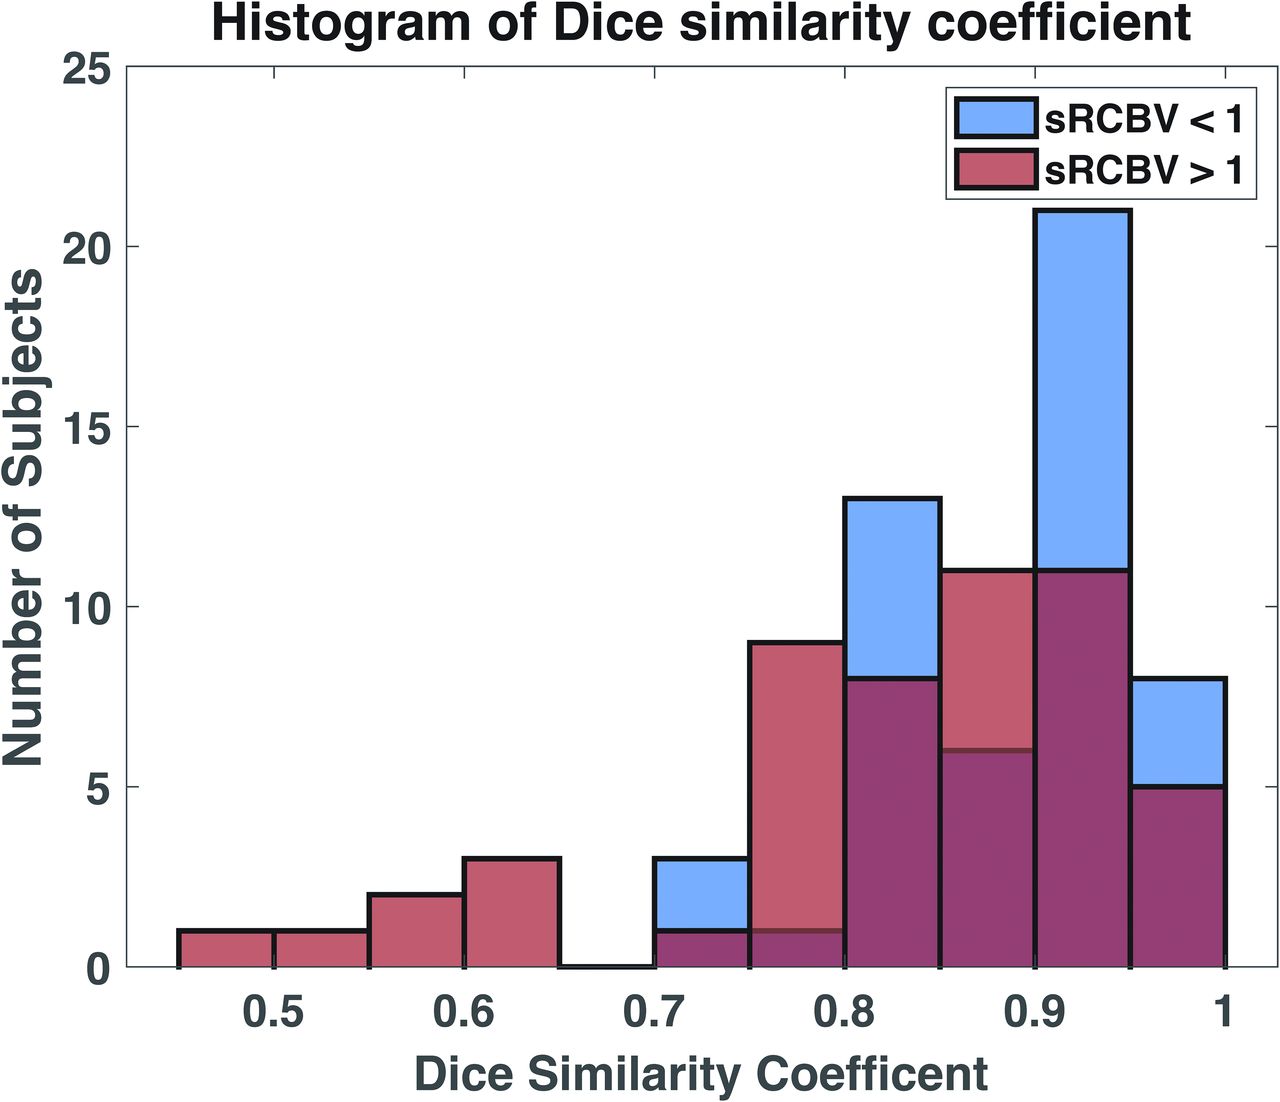
Figure 5 shows representative postcontrast T1-weighted images depicting the enhancing tumor and the corresponding FTB maps for the LFA protocol (computed using the optimum thresholds derived from the ROC analysis, 1.0 and 1.37) and the MFA protocol (computed using the reference thresholds 1.0 and 1.56). Figure 6 displays the histogram of the Dice similarity coefficient across each patient for regions of PTRE (sRCBV <1.0) and tumors (sRCBV >1.0). The Dice value for PTRE ranges from 0.71 to 0.98, while for tumors, it ranges from 0.46 to 0.98. The FTB maps for the subjects with a low Dice value are shown in the Online Supplemental Data.

A–C, The patient shown is a 73-year-old woman with grade-IV glioblastoma presenting 15 months after surgical resection. D–F, The patient shown is a 34-year-old man with grade-IV glioblastoma presenting 20 months after surgical resection. Images include anatomic postcontrast T1-weighted images (A and D), FTB maps for the single-dose, LFA protocol (B and E) by using 1.0 and 1.37, and the reference double-dose, MFA protocol (C and F) by using 1.0 and 1.56 superimposed on the contrast-enhanced T1-weighted images. Blue, yellow, and red voxels represent PTRE (FTBlow, sRCBV <1.0), tumor/treatment effect admixture (FTBmid, 1.0 > sRCBV <1.37 [LFA], 1.56 [MFA]), and high tumor cell probability (FTBhigh, sRCBV >1.37 [LFA], 1.56 [MFA]), respectively. The Dice similarity coefficients comparing the LFA and MFA sRCBV for PTRE and tumor recurrence for the patient in (A–C) are 0.85 and 0.87, respectively. For the patient in (D–F), the coefficients are 0.77 for PTRE and 0.96 for tumor recurrence.

Histogram of Dice similarity coefficient between the regions of PTRE (sRCBV <1.0) and tumor recurrence (sRCBV >1.0) for each patient. Ninety-two percent and 67% of the subjects show a Dice similarity coefficient greater than 0.8 for sRCBV <1.0 and sRCBV >1.0, respectively.
DISCUSSION
With increased adoption of the new consensus recommendations for DSC-MRI acquisition and analysis protocols, the role of DSC-MRI in distinguishing tumor recurrence and treatment effects is growing. Although the MFA protocol with preload is known to produce robust rCBV maps, it does incur additional cost and adds a potential source of variability due to potential differences in incubation time between the preload and bolus injection. By leveraging a patient-based and validated DSC-MRI digital reference object, Semmineh et al40 demonstrated that a protocol consisting of a single bolus injection (with no preload) and an LFA provided comparable rCBV accuracy across field strengths while reducing the contrast agent dosage and maintaining the brain tumor imaging protocol compliance. The proposed LFA protocol was next validated in a multisite study, which found a CCC between sRCBV values obtained using LFA without preload and MFA with preload of 0.96.39 In this single-site study, we corroborated the strong agreement between the LFA and MFA mean tumor sRCBV values (CCC = 0.99).
FTB maps offer a spatial quantification of both tumor and treatment effects, which often coexist within a lesion.28 To determine the sRCBV threshold, we utilized FDA-cleared, clinically available software that computes standardized, leakage-corrected rCBV maps from DSC-MR imaging data. Previous studies have demonstrated that normalized and standardized rCBV maps have similar predictive performance.24,25 However, the standardization technique eliminates the need for user-dependent ROIs, which are necessary for normalization, and can be applied across field strengths and vendors, thereby improving rCBV reproducibility across patients and sites.23,25
Previous studies have published a wide range of rCBV thresholds to distinguish between recurrent tumor and treatment effects.31 However, by using MFA acquisition protocols consistent with the DSC-MR imaging consensus recommendation,37 a lower threshold of 1.0 to distinguish pure PTRE (<1.0) from the presence of a tumor (>1.0) has been validated by 2 independent studies by using image-guided histopathology.27,28 Use of this lower threshold to distinguish PTRE from tissue comprising a tumor has been emphasized in this study when using the LFA acquisition methods.
What remains less clear is which upper threshold to use with FTB maps to distinguish a highly vascular tumor from a tumor with intermediate sRCBV values. In the posttreatment setting, there is wide variability in the degree of microvascular proliferation of a recurrent tumor. Invasive tumors or tumors with microscopic admixture with treatment effect may result in moderate values above 1.0, but not in the highly elevated range. Meanwhile, a bulk tumor with high microvascular proliferation may result in a markedly elevated rCBV. Using a normalized rCBV threshold of 1.75 to distinguish moderate versus high rCBV has been shown to be helpful for predicting overall survival.22 Though this threshold was originally identified for prognostic purposes, it has also been used as an upper threshold for the creation of the FTB class maps demonstrating clinical relevance.35,41 Alternatively, the sRCBV upper threshold of 1.56 is based on the histopathology results indicating an 88% probability for detecting tumor cells.27 In the present study, an optimal upper threshold for LFA acquisition was identified in reference to the 1.56 threshold.27,29,30 The ROC analysis identified 1.0 as the lower threshold and 1.37 as the optimum upper threshold that yielded a maximum Youden index for 1.0 and 1.56 reference thresholds, respectively. Given the variability in the size of the enhancing ROI among the patients, the ROC analysis incorporated inverse weighting based on the size of each patient’s enhancing tumor volume. Despite applying thresholds of 1.0 and 1.37 for the LFA protocol, Dice values tend to be low in patients with small enhancing ROIs, primarily with resection cavities, due to the limited number of voxels available. However, the clinical interpretations of the 2 maps remain consistent (predominantly PTRE).
In conclusion, this study demonstrates that the single-dose, LFA protocol is a reliable method for distinguishing between tumors and PTRE. There are several limitations that are inherent with this type of retrospective study. In particular, the scope of clinical information acquired and available for analysis is variable, including incomplete clinical-radiologic follow-up and pathologic analysis of patients who may have undergone a second surgery/biopsy. A potential limitation of the study is the absence of histopathology correlation, despite using the well-validated MFA-protocol–based FTB maps as a reference. However, we acknowledge that the reported sensitivity and specificity should be interpreted in regard to how well the LFA-based FTB maps agree with the MFA-based FTB maps and not necessarily histopathologic ground truth. Similarly, future studies should validate the correlation between the derived LFA-based upper thresholds, radiographic progression, and patient prognosis. Clinically, it would be compelling to also evaluate whether LFA-based FTB maps impact patient care (ie, tumor board decisions), as they reduce the preload dose of gadolinium injection and eliminate potential errors arising from variations in contrast agent incubation time and dosing. Even though data for this retrospective study were acquired on a single MR imaging scanner, the previous consensus protocol study performed across multiple scanners and multiple sites established strong agreement between the single-dose, LFA and double-dose, MFA protocols.39 The focus of this study was to identify the thresholds for robust FTB mapping, specifically those that demarcate treatment effects from tumor recurrence and identify regions with a high probability of viable tumor cells.24,26,27 Given the limited sample size included in this study, the upper threshold could vary with a different population. Thus, the prospective validation of the thresholds in a larger study, and including image-guided histopathology, is a future research area to promote clinical adoption.
CONCLUSIONS
This study provides experimental evidence showing that LFA FTB mapping can reliably distinguish tumor recurrence from treatment effects. This study provides further motivation for the use of the no-preload LFA protocol in the management of patients with glioblastoma.
Acknowledgments
We would like to acknowledge Belinda Gutierrez for helping us obtain the data.
Footnotes
This work was supported by the National Institutes of Health/National Cancer Institute (Grant No. R01CA264992 to C. Chad Quarles, No. U01CA176110 to Kathleen M. Schmainda, and No. R01CA213158 to C. Chad Quarles, No. U01CA250481, U01CA220378, R01CA221938 to Leland S. Hu) and the Cancer Prevention and Research Institute of Texas (Grant No. RR220038 to C. Chad Quarles). C. Chad Quarles is a CPRIT Scholar of Cancer Research.
Disclosure forms provided by the authors are available with the full text and PDF of this article at www.ajnr.org.
References
- 1.
- 2.
- 3.
- 4.
- 5.
- 6.
- 7.
- 8.
- 9.
- 10.
- 11.
- 12.
- 13.
- 14.
- 15.
- 16.
- 17.
- 18.
- 19.
- 20.
- 21.
- 22.
- 23.
- 24.
- 25.
- 26.
- 27.
- 28.
- 29.
- 30.
- 31.
- 32.
- 33.
- 34.
- 35.
- 36.
- 37.
- 38.
- 39.
- 40.
- 41.
- Received February 1, 2024.
- Accepted after revision May 21, 2024.
- © 2024 by American Journal of Neuroradiology