Abstract
BACKGROUND AND PURPOSE: Vertebral compression fractures may indicate osteoporosis but are underdiagnosed and underreported by radiologists. We have developed an ensemble of vertebral body (VB) segmentation models for lateral radiographs as a critical component of an automated, opportunistic screening tool. Our goal is to detect the approximate location of thoracic and lumbar VBs, including fractured vertebra, on lateral radiographs.
MATERIALS AND METHODS: The Osteoporotic Fractures in Men Study (MrOS) data set includes spine radiographs of 5994 men aged ≥65 years from 6 clinical centers. Two segmentation models, U-Net and Mask-RCNN (Region-based Convolutional Neural Network), were independently trained on the MrOS data set retrospectively, and an ensemble was created by combining them. Primary performance metrics for VB detection success included precision, recall, and F1 score for object detection on a held-out test set. Intersection over union (IoU) and Dice coefficient were also calculated as secondary metrics of performance for the test set. A separate external data set from a quaternary health care enterprise was acquired to test generalizability, comprising diagnostic clinical radiographs from men and women aged ≥65 years.
RESULTS: The trained models achieved F1 score of U-Net = 83.42%, Mask-RCNN = 86.30%, and ensemble = 88.34% in detecting all VBs, and F1 score of U-Net = 87.88%, Mask-RCNN = 92.31%, and ensemble = 97.14% in detecting severely fractured vertebrae. The trained models achieved an average IoU per VB of 0.759 for U-Net and 0.709 for Mask-RCNN. The trained models achieved F1 score of U-Net = 81.11%, Mask-RCNN = 79.24%, and ensemble = 87.72% in detecting all VBs in the external data set.
CONCLUSIONS: An ensemble model combining predictions from U-Net and Mask-RCNN resulted in the best performance in detecting VBs on lateral radiographs and generalized well to an external data set. This model could be a key component of a pipeline to detect fractures on all vertebrae in a radiograph in an automated, opportunistic screening tool under development.
ABBREVIATIONS:
- IoU
- intersection over union
- m2ABQ
- modified-2 algorithm based qualitative fracture classification system
- MrOS
- Osteoporotic Fractures in Men Study
- OCF
- osteoporotic compression fracture
- PPV
- positive predictive value
- VB
- vertebral body
SUMMARY
PREVIOUS LITERATURE:
Osteoporosis is a chronic disease of low bone mineral attenuation affecting millions of Americans that predisposes osteoporotic compression fractures (OCFs), sometimes escaping clinical detection. Because OCFs are underreported and underdiagnosed, an automated tool could facilitate opportunistic screening, where vertebral body (VB) segmentation is essential for many downstream analyses, including fracture classification. Several groups have developed segmentation models for automated VB detection on radiographs but were limited by small, single-institutional data sets, risking overfitting. These also did not report on models’ performance in detecting nonfractured versus fractured vertebrae.
KEY FINDINGS:
U-Net and Mask-RCNN, and the ensemble model accurately detected the location of VBs centroids on lateral radiographs. Using centroids of predicted segmentation masks for a rule-based ensemble model of U-Net and Mask-RCNN demonstrated increased performance in detecting true-positive VBs. On an external data set of diagnostic clinical radiographs acquired from a quaternary health care enterprise, the models achieved F1 score of U-Net = 81.11%, Mask-RCNN = 79.24%, and ensemble = 87.72% in detecting all VBs, demonstrating generalizability.
KNOWLEDGE ADVANCEMENT:
Using centroids as an alternate approach to analyzing segmentation masks, a rule-based ensemble of segmentation models demonstrated increased performance in detecting the approximate location of VBs on radiographs. This methodology will be a critical step in an automated, opportunistic screening tool for osteoporosis under development.
Osteoporosis is a chronic disease of low bone mineral attenuation affecting approximately 10 million Americans over age 50.1 It increases the risk of fractures, including osteoporotic compression fractures (OCFs), and the risk of subsequent OCFs.2 OCFs are associated with increased morbidity and mortality and lower quality of life.3 Although osteoporosis screening is evidence-based and recommended by the US Preventive Services Task Force, screening is grossly underutilized.4,5 While vertebral compression fractures may have other causes, osteoporosis is often the culprit in older individuals. These fractures sometimes escape clinical detection and are associated with frailty. An automated tool to detect OCFs on radiographs could facilitate opportunistic screening, because OCFs are underdiagnosed and underreported by radiologists.6⇓-8
Radiography is a high-volume technique utilized early in diagnostic work-ups, with approximately 275 million examinations performed in 2016 in the United States, making it an ideal candidate for study.9 A critical component of an automated diagnostic tool for lateral spine radiography is sufficiently accurate localization of vertebral bodies. It is well known that image classification performs better with a cropped region of interest around the object to be classified.10,11 For this reason, many classification models use upstream semiautomated or manual segmentation of VBs.12
Unlike CT and other modalities, radiographic systems have less standardization, and radiographs pose unique challenges as they are projection images with superimposing objects. However, radiographs’ ubiquity in clinical practice, low radiation dose, and relatively low cost, present an excellent opportunity for screening. Several prior studies of segmentation models compared performance in detecting VBs on thoracic and lumbar lateral radiographs13,14 but had several limitations, including small data sets from single institutions predisposing overfitting. For this study, we applied 2 convolutional neural network architectures to a large multi-institutional data set. U-Net, developed in 2015, is frequently used for semantic segmentation.15 Mask-RCNN (Region-based Convolutional Neural Network), developed in 2017, has a more complex architecture and better performance in object detection tasks.16 One study reported successful training of U-Net on 124 lateral radiographs (40 images in the test set).17 To date, there have been no studies exploring combining results from these 2 models.
In this work, we focused on detecting the approximate location of all VBs in a radiograph. We hypothesized that a rule-based ensemble of segmentation models could outperform either alone, while providing an alternate approach to analyzing segmentation masks.
This article follows the Transparent Reporting of a Multivariable Prediction Model for Individual Prognosis Or Diagnosis Checklist.18
MATERIALS AND METHODS
A pre-existing multicenter deidentified annotated radiograph data set was obtained from the Osteoporotic Fractures in Men Study (MrOS) Coordinating Center under a data use agreement. A total of 5994 consenting men aged ≥65 years19 enrolled between 2000 and 2002 with 2 lateral thoracic and lumbar spine radiographs separated by 4.5 years.20,21
The MrOS team, by using a semiautomated tool (SpineAnalyzer, Optasia Medical) to mark VB outlines, previously annotated ground truth.21 VBs on both thoracic and lumbar radiographs were only annotated on 1 of the thoracic or lumbar radiographs; VBs were annotated from T5 to T12 or L1 and T12 or L1 to L3 or L4 on thoracic and lumbar radiographs, respectively.21
Each annotated VB was labeled with the Genant semiquantitative criteria.22 We pooled moderate or severe fractures as “fractured” and normal or mild VBs as “nonfractured” to simplify predictor development and assessment while preserving the most clinically impactful findings. Models were trained, validated, and tested on 6695, 1310, and 2346 images, respectively, which were split randomly by patient (Table 1).
Demographics of MrOS data
DICOM radiograph images were converted to 16-bit TIFF files; each was downsampled to 512 × 512 pixels with zero-padding to preserve the original aspect ratio. For Mask-RCNN, files were converted to 8-bit. For U-Net, images were preprocessed by using contrast limited adaptive histogram equalization.23,24 Because contrast limited adaptive histogram equalization processed images led to technical errors in Mask-RCNN training, nonprocessed images were used. No other normalization or standardization techniques were performed for either U-Net or Mask-RCNN.
U-Net was trained de novo on the semantic segmentation task.15 Further details are discussed in the Online Supplemental Data. Mask-RCNN was trained on the instance segmentation task.16 Transfer learning was applied by importing pretrained weights trained on the COCO data set, then fine-tuned on the MrOS data set. See further details in the Online Supplemental Data.
For U-Net, the output was binarized, and individual VBs were distinguished by considering separate contiguous patches filtered for size, producing centroid coordinates. For Mask-RCNN, centroid coordinates were calculated from each individual VB segmentation mask. See further details in the Online Supplemental Data.
VB centroids were filtered based on their horizontal position. Those far enough from the mean horizontal coordinate, standardized by the average endplate width, were considered “off-column,” and excluded from subsequent analysis. Further details are in the Online Supplemental Data.
An ensemble model was created by pooling predictions from both models and eliminating duplicates. Duplicates were identified by a threshold on the centroid distance of one-half the average endplate width per image. Nonduplicate U-Net centroids were appended to Mask-RCNN centroids. Further details are in the Online Supplemental Data.
As not all visible VBs were labeled by the MrOS team (eg, L1 or L2 on a thoracic radiograph); a random subset of radiographs (n = 199) from the held-out test set (n = 2346) were annotated completely by a board-certified neuroradiologist. Thirty radiographs included at least 1 fractured vertebrae to reflect the prevalence of the full held-out test set. DicomAnnotator25 was used to identify nonannotated VBs with 4 corner points within the image. These were marked with a centroid and labeled by using the modified-2 algorithm based qualitative fracture classification system (m2ABQ).26 A total of 471 VBs was added to the original 1268.
Models were evaluated primarily on detection success and secondarily on detection quality. The distance between each predicted centroid and the centroid of the nearest ground truth was calculated as the “centroid distance” (Fig 1). Centroids were used as the measure of approximate location and are robust to small errors in segmentation. Because magnification of anatomy varies among radiographs, centroid distance was normalized by the average endplate width of ground truth annotations per radiograph.

Right, Example of calculating the centroid distance and the endplate width for a given vertebral body. The dotted line represents the Euclidean distance (pixels) between the ground truth (black) centroid and the predicted (white) centroid, the center of the box. The horizontal solid lines represent the superior and inferior endplate width. Normalized centroid distance % = Length(Dotted)/Avg(Length(Solid)). Left, Original image.
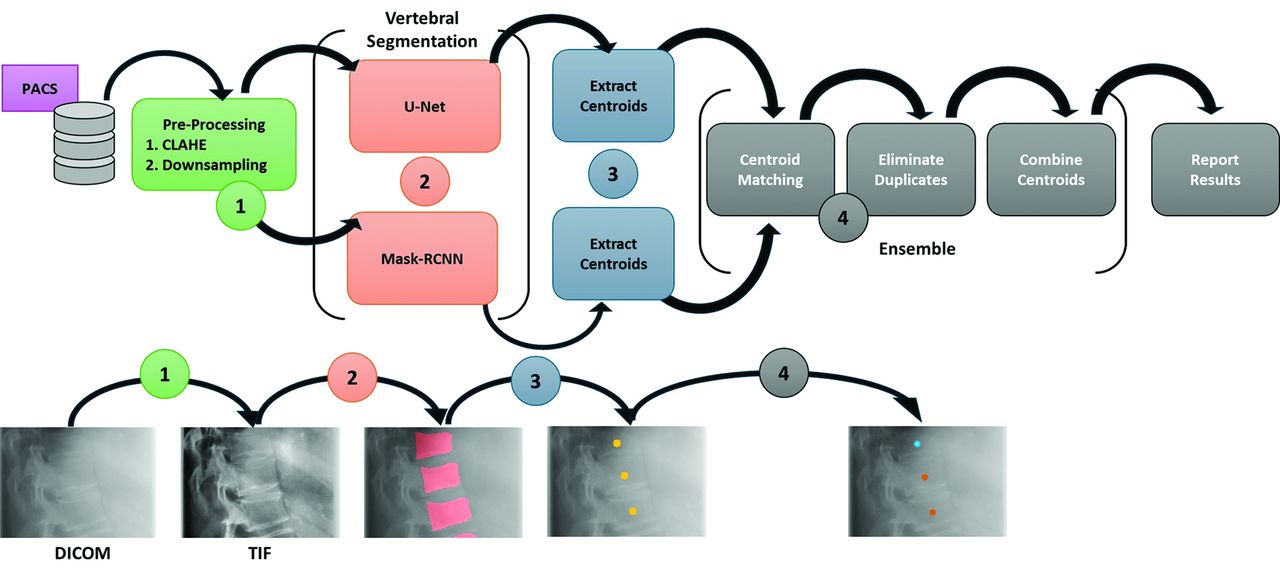
A threshold was set for centroid distance to measure object detection performance, and precision (positive predictive value [PPV]), recall (sensitivity), and F1 score (performance metrics and Online Supplemental Data). A flowchart of our workflow is shown in Fig 2. Segmentations with high intersection over union (IoU) scores are not necessary for our intended use-case. However, IoU and Dice coefficient were used as additional measures of segmentation quality. Details are discussed in the Online Supplemental Data.

Flowchart of workflow. Each radiograph image was cropped to show a focused view of each step. 1) DICOM radiographs are converted to TIF files, preprocessed with CLAHE, and downsampled. 2) Each TIF is input into the segmentation models for VB detection. 3) Centroids are extracted from each predicted segmentation mask, represented as yellow points. 4) Centroids are matched based on a distance threshold and duplicates are eliminated, producing a final pool of ensemble centroids. Orange centroids represent “matches” between U-Net and Mask-RCNN while blue centroids represent “nonmatches.”
Two neuroradiologists manually reviewed 27 radiographs from the held-out test set with “off-column” predictions and 52 radiographs with false-negative, or missed, detections, to discern if specific radiologic features were associated with the observed failure patterns for both models.
Another set of diagnostic clinical radiographs were obtained from a quaternary health care enterprise to test generalizability. VBs on spine radiographs, originally generated between 2000 and 2017, were annotated by 4 radiologists; each VB’s 4 corner points and OCF severity were annotated with DicomAnnotator.25 Lateral radiographs of the spine were sampled randomly (n = 188), and images with hardware, swimmer’s views, and views other than lateral thoracic or lumbar spine were excluded. Images were harmonized to be white-bone and right-facing, like the MrOS data set. For U-Net they were converted to single-channel, grayscale images. Metadata are described in Table 2. The quantity of radiographs was selected to be several times greater than the size of test partitions in previous work.
Demographics and metadata of external validation data set
All models were evaluated on the external data set. Manual tuning of preprocessing and postprocessing hyperparameters was performed: the contrast limited adaptive histogram equalization clipLimit parameter was set to 5, and the binarization threshold for U-Net was set to 0.61. Performance metrics were calculated in the same fashion except for manual review and the Dice coefficient/IoU, which were not done for these data. Performance metrics were also reported for fractured versus nonfractured versus all vertebrae.
RESULTS
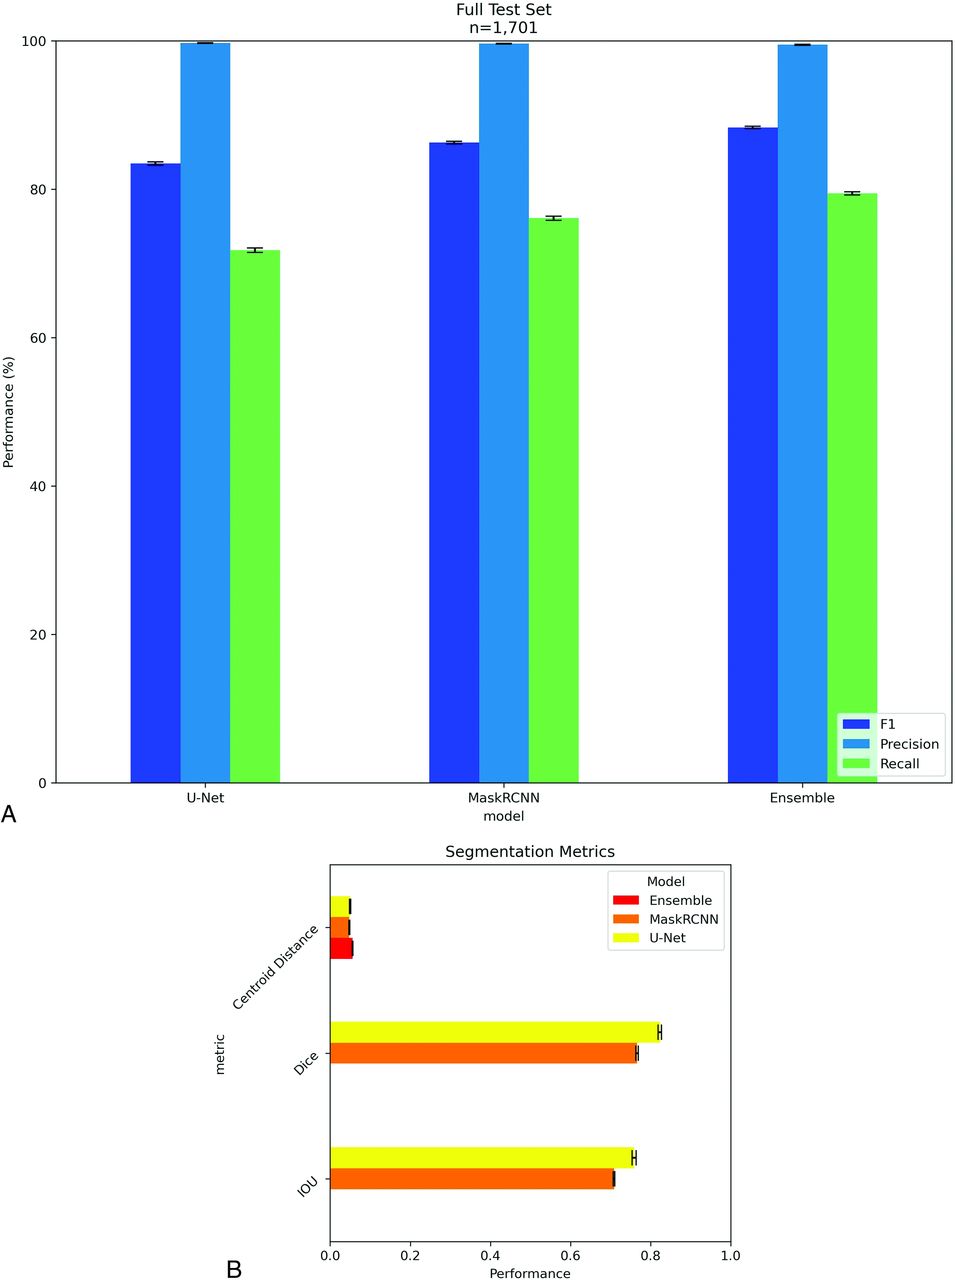
Detection success was quantified on a per-VB basis on the original MrOS annotations. Examples of a successful detection of a fractured vertebrae (Fig 3A) and successful ensemble of centroids (Fig 3B) are shown. Performance metrics with 95% CI are plotted in Fig 4. Performance metrics were high in the test partition with recall of 91.28%, 94.01%, and 95.73% for U-Net, Mask-RCNN, and the ensemble model, respectively.

A, Example of successful detection by Mask-RCNN of fractured vertebra, marked by the red arrow. Left, Ground truth (green) segmentation masks overlayed on prediction (red) masks. Overlaps are shown in yellow. Middle, Predicted (red) segmentation masks from Mask-RCNN. Right, Centroids. B, Example of ensemble centroids from U-Net and Mask-RCNN. Orange centroids represent “matches” between U-Net and Mask-RCNN while blue centroids represent “nonmatches.” The blue centroid marked by the red arrow denotes a fractured vertebrae that was detected by only 1 model. The blue centroid marked by the purple arrow denotes an “off-column” detection.

A, Object detection scores on the MrOS test partition. Error bars are the 95% CI calculated with the bootstrap. N is the number of vertebral bodies. B, Segmentation scores on the MrOS test partition. IoU, Sorenson Dice coefficient, and centroid distance are reported as percentages.
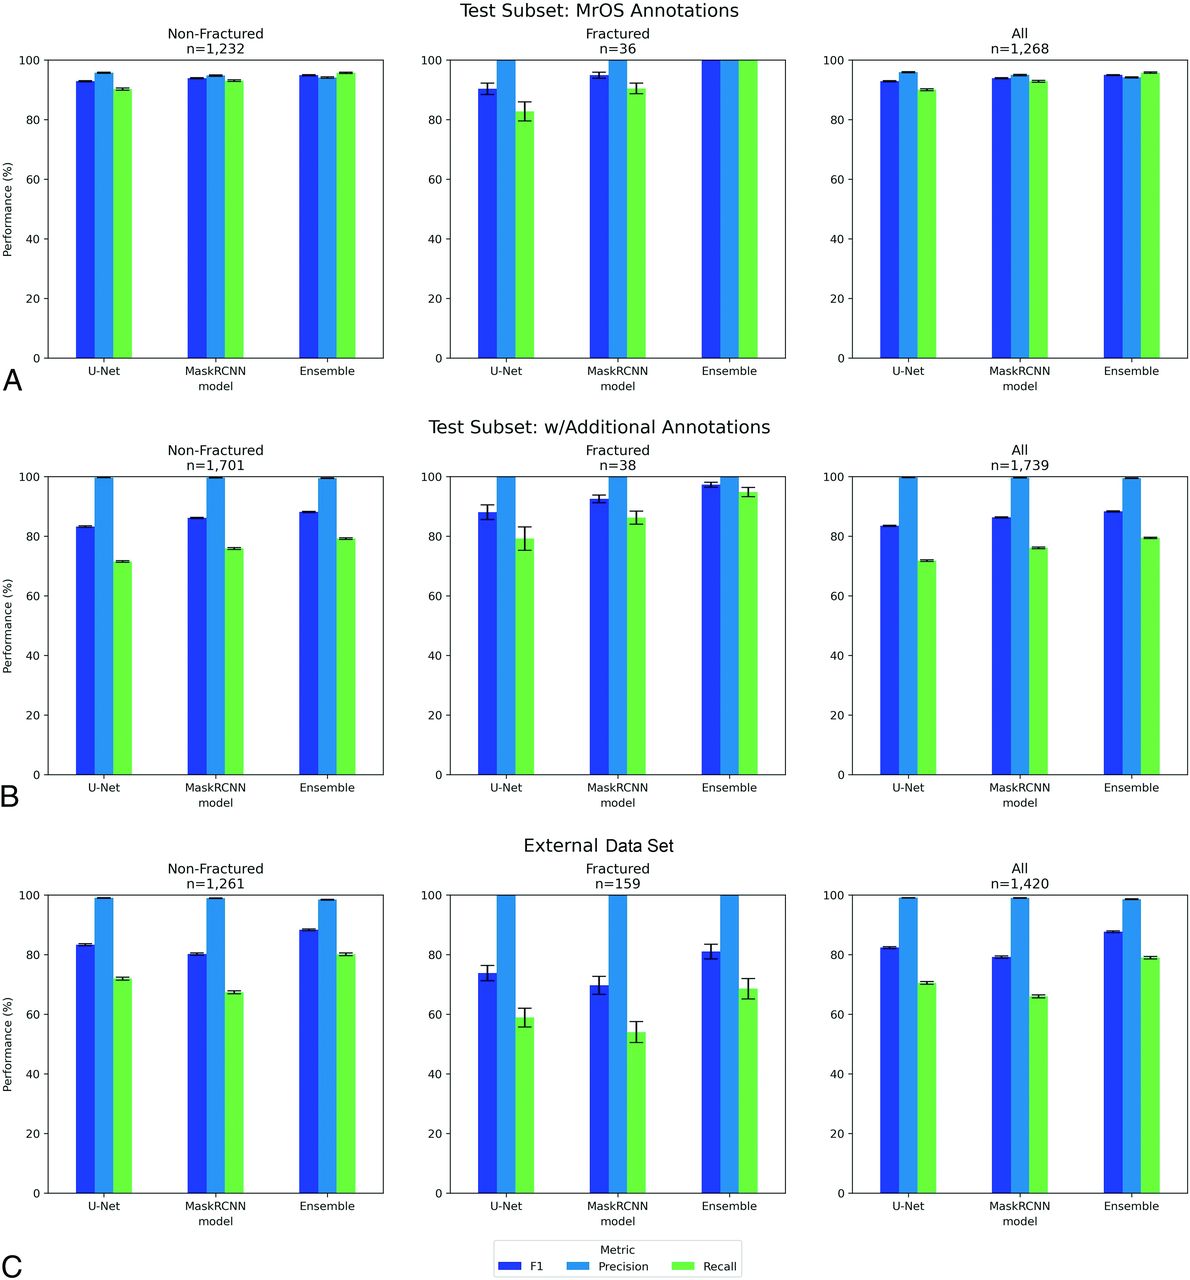
Performance on the random subset from the MrOS test partition (n = 199 radiographs) with and without the annotations of additional VBs is shown in Fig 5A and Fig 5B. Metrics are reported for nonfractured versus fractured versus all vertebrae for U-Net, Mask-RCNN, and the ensemble model. Performance with the additional annotations had higher PPV (approaching 100%), but lower sensitivity by around 10 points.

A, Object detection scores by fracture status for the subset of the MrOS data set test partition. Error bars are the 95% CI calculated with the bootstrap. N is the number of vertebral bodies. Subgroups by fracture status. B, Object detection scores by fracture status for the subset of the MrOS data set test partition with additional annotations of missing VBs. Error bars are the 95% CI calculated with the bootstrap. N is the number of vertebral bodies. Subgroups by fracture status. C, Object detection scores by fracture status for the external validation (non-MrOS) set. Error bars are the 95% CI calculated with the bootstrap. N is the number of vertebral bodies. Subgroups by fracture status.
Performance on the external data set is plotted in Fig 5C. Compared with the MrOS subset with additional annotations, overall sensitivity decreased approximately 15 points while PPV remained high. Within the external data set, sensitivity of fractured vertebrae was lower by approximately 11 points compared with that of nonfractured vertebrae.
Fig 4B describes the detection quality metrics for each model on the MrOS test data. All models had comparable average centroid displacement. U-Net had a higher average IoU compared with Mask-RCNN. Dice coefficients were higher than IoU but trended similarly among models. The ensemble model pools centroids extracted from U-Net and Mask-RCNN segmentations, so IoU and Dice scores were not applicable.
Several failure modes were observed across U-Net and Mask-RCNN predictions. In 52 of 2346 radiographs, the models had at least 1 false-negative (missed VB detection) compared with the MrOS ground truth annotations in the middle of the inferred spinal column (Online Supplemental Data). Both models had difficulty detecting VBs in the presence of hardware (Online Supplemental Data). In the subset of fully annotated radiographs, VBs at the superior and inferior ends that were originally not annotated were often not detected (Online Supplemental Data). Of the 356 false-negatives from the ensemble model on the fully annotated subset, 347 were at the superior and inferior ends (Online Supplemental Data).
A variety of anatomic structures and boundaries presented challenges to the models in detecting VBs on a small subset of radiographs. Neuroradiologists suggested the following features were associated with false-positives: overlap of VBs with ribs, bowel gas, spinous processes, and the diaphragm. For false-negative detections, radiologists commented that reversed contrast and underexposure, marked transition in attenuation, parallax, and diffuse idiopathic skeletal hyperostosis were repeatedly observed. Example cases are shown in Online Supplemental Data.
DISCUSSION
Automated imaging analysis pipelines have become achievable. VB segmentation is essential for many downstream analyses, including fracture classification. While extensive work has been done to segment vertebrae from CT images,27⇓-29 image processing and machine learning methods differ considerably from segmentation on radiographs. Several groups have trained and developed segmentation models for automated VB detection from radiographs. Kim et al14 trained segmentation models to measure vertebral compression ratios. Kónya et al13 compared several segmentation models in detecting VBs on lumbar lateral radiographs. These studies were limited by small, single-institutional data sets, risking overfitting. Our data set included more than 10,000 radiographs of the thoracic and lumbar spine from a multi-institutional cohort across the United States, with validation on an external clinical cohort. Prior studies commented on models’ abilities to detect fractured vertebrae but did not compare performance in detecting nonfractured versus fractured vertebrae, while this work does.
Both U-Net and Mask-RCNN achieved high PPV in detecting VBs on the original MrOS annotations and the fully annotated subset. The ensemble model had slightly lower PPV, suggesting both U-Net and Mask-RCNN uniquely produced false-positives but importantly had higher sensitivity and F1 score, indicating VBs that were not detected by U-Net were detected by Mask-RCNN and vice versa, ie, the models were complementary. Overall, the ensemble of the 2 models increased sensitivity considerably with minimal loss in PPV.
As expected, the additional annotations increased PPV but lowered sensitivity, as some false-positives became true-positives, but more false-negatives were identified. False-negatives were clustered at the edges of the image (Online Supplemental Data), matching the limited annotations of the MrOS training data.
All 3 models achieved high performance in detecting fractured vertebrae, despite the class imbalance in the training set. This demonstrated that both U-Net and Mask-RCNN can detect VBs with different contours and geometry. Interestingly, model performance was slightly better on fractured vertebrae on both the original and additional annotations. This may be due to the small sample of fractured vertebrae, but also because fractures tend to cluster in T12–L2 in the center of the image, where the model performed best and had the greatest training data. Recent studies indicate 60%–75% of fractures occur between T12–L2, and another 30% occur between L2–L5.30
The performance on the external data set was lower compared with the fully annotated internal (MrOS) subset, which is expected when applying a model on data different from the training set. The external data set differed considerably from the training and internal test sets in that it was acquired entirely digitally, the demographics were broader, and the radiographs were captured in clinical settings with a variety of protocols and variation in quality. This may have contributed to the lower sensitivity of fractured vertebrae. Using only parameter tuning of the pre- and postprocessing steps (without fine-tuning of the neural-net model), the ensemble model maintained an excellent PPV and fairly high F1 score overall, with shortcomings mainly in sensitivity.
The MrOS annotations were created for objectives different from that of this work and were not optimal for evaluating model performance detecting all relevant VBs on a radiograph. There were often several visible VBs in radiographs that were not annotated (Online Supplemental Data). We accounted for this by fully annotating a subset of the test partition to evaluate the performance in detecting all VBs present on a radiograph. The MrOS data set was also collected for research, optimized to show bone, and is more than 20 years old, lacking data about scanner vendor. These data are also homogeneous in demographics, containing only men who were predominantly white, which may have introduced bias given sex and ethnicity differences in bone mineral attenuation and morphology.31⇓-33 These limitations were partially addressed by evaluation on the external data set. The lower sensitivity on the external data set would be: 1) less problematic at the patient level because only 1 detected fracture is required to refer a patient to a provider; and 2) less impactful to osteoporotic fracture detection because many of the missed vertebrae are in regions of the spine where osteoporotic fractures infrequently occur. In addition, the method of filtering out “off-column” detections is somewhat crude and may be overly conservative in cases with severe kyphosis or lordosis. Further evaluation of generalizability, performance, and bias will be necessary before integration into clinical workflows.
The largest opportunity for improvement lies in increasing sensitivity on the external data set. False-negatives could be recovered (and sensitivity increased) by exploiting domain knowledge: VBs are expected to be found at consistent vertical intervals along a curve. An improved method might feature spine centerline estimation to infer missing centroids and improve the centroid-spine-centerline distance calculation. Incorporating additional models into the ensemble may also improve overall performance, especially sensitivity. In addition, training on more varied data sets of radiographs obtained in clinical settings would likely increase overall performance and produce a model generalizable across institutions.
Applications of this work could reference predicted centroids to crop a region and perform fracture detection, a problem for which models have been described previously.12 An automatic tool with high PPV could be valuable in triaging studies in high volume clinical settings. This could facilitate broader screening for OCFs, potentially catching cases where intervention could prevent additional complications. On top of providing a tool to the diagnostic radiologist, an automated diagnostic model could be applied retrospectively to flag patients for additional clinical scrutiny or to generate research cohorts. It could also be applied judiciously in low resource settings to help nonradiologists and trainees assess scans before review by a radiologist.
This work is also agnostic of the diagnostic question; it could be chained with classification models for any disease where a plain film of a VB is relevant. However, considerable evaluation and testing, including evaluating bias, will be necessary before clinical application.
CONCLUSIONS
An ensemble model combining the predictions from 2 independent segmentation models increased performance by 2%–5% in detecting VBs on lateral radiographs of the thoracic and lumbar spine compared with either model individually. The ensemble model also demonstrated high performance (F1 score of 97%) in detecting fractured vertebrae, and some generalizability on an external data set of radiographs captured in clinical settings showing that this approach, with additional work to improve sensitivity, could serve as a precursor component in diagnostic pipelines.
Footnotes
This work was supported by the University of Washington Clinical Learning, Evidence, And Research (CLEAR) Center for Musculoskeletal Disorders, Administrative, Methodologic Cores and National Institute of Arthritis and Musculoskeletal and Skin Diseases/National Institutes of Health (NIAMS/NIH) grant P30AR072572; and supported in part by the General Electric-Association of University Radiologists Radiology Research Academic Fellowship (GERRAF, Dr. Cross), a career development award co-sponsored by General Electric Healthcare and the Association of University Radiologists. The content is solely the responsibility of the authors and does not necessarily represent the official views of the NIH.
The Osteoporotic Fractures in Men Study (MrOS) is supported by NIH funding. The following institutes provide support: the National Institute on Aging (NIA), NIAMS, the National Center for Advancing Translational Sciences (NCATS), and NIH Roadmap for Medical Research under the following grant numbers: U01 AG027810, U01 AG042124, U01 AG042139, U01 AG042140, U01 AG042143, U01 AG042145, U01 AG042168, U01 AR066160, R01 AG066671, and UL1 TR000128.
Gang Luo was partially supported by the National Heart, Lung, and Blood Institute of the National Institutes of Health under Award R01HL142503.
Brian Chang was supported by the National Library of Medicine training grant T15LM007442.
Disclosure forms provided by the authors are available with the full text and PDF of this article at www.ajnr.org.
References
- 1.
- 2.
- 3.
- 4.
- 5.
- 6.
- 7.
- 8.
- 9.
- 10.
- 11.
- 12.
- 13.
- 14.
- 15.
- 16.
- 17.
- 18.
- 19.
- 20.
- 21.
- 22.
- 23.
- 24.
- 25.
- 26.
- 27.
- 28.
- 29.
- 30.
- 31.
- 32.
- 33.
- Received February 9, 2024.
- Accepted after revision May 3, 2024.
- © 2024 by American Journal of Neuroradiology