Abstract
BACKGROUND AND PURPOSE: Patients with brain tumors have high intersubject variation in putative language regions, which may limit the utility of straightforward application of healthy subject brain atlases in clinical scenarios. The purpose of this study was to develop a probabilistic functional brain atlas that consolidates language functional activations of sentence completion and Silent Word Generation language paradigms using a large sample of patients with brain tumors.
MATERIALS AND METHODS: The atlas was developed using retrospectively collected fMRI data from patients with brain tumors who underwent their first standard-of-care presurgical language fMRI scan at our institution between July 18, 2015, and May 13, 2022. Three hundred seventeen patients (861 fMRI scans) were used to develop the language functional atlas. An independent presurgical language fMRI data set of 39 patients with brain tumors from a previous study was used to evaluate our atlas. Family-wise error–corrected binary functional activation maps from sentence completion, letter fluency, and category fluency presurgical fMRI were used to create probability overlap maps and pooled probabilistic overlap maps in Montreal Neurological Institute standard space. The Wilcoxon signed-rank test was used to determine a significant difference in the maximum Dice coefficient for our atlas compared with a meta-analysis-based template with respect to expert-delineated primary language area activations.
RESULTS: Probabilities of activating the left anterior primary language area and left posterior primary language area in the temporal lobe were 87.9% and 91.5%, respectively, for sentence completion, 88.5% and 74.2%, respectively, for letter fluency, and 83.6% and 67.6%, respectively, for category fluency. Maximum Dice coefficients for templates derived from our language atlas were significantly higher than the meta-analysis-based template in the left anterior primary language area (0.351 and 0.326, respectively, P < .05) and the left posterior primary language area in the temporal lobe (0.274 and 0.244, respectively, P < .005).
CONCLUSIONS: Brain tumor patient- and paradigm-specific probabilistic language atlases were developed. These atlases had superior spatial agreement with fMRI activations in individual patients compared with the meta-analysis-based template.
ABBREVIATIONS:
- aPLA
- anterior PLA
- BTLA
- basal temporal language area
- CAT
- category fluency
- DLPFC
- dorsolateral prefrontal cortex
- LETT
- letter fluency
- MNI
- Montreal Neurological Institute
- PLA
- primary language area
- POM
- probabilistic overlap map
- pPLAP
- posterior PLA in the parietal lobe
- pPLAT
- posterior PLA in the temporal lobe
- SENT
- sentence completion
- SMA
- supplementary motor area
SUMMARY
PREVIOUS LITERATURE:
The analysis of language fMRI data acquired from brain tumor patients is typically supported by atlases developed from predominantly healthy subjects. However substantial intersubject in brain tumor patients may adversely affect the utility of straightforward application of such atlases. While disease-specific population-based structural brain atlases have been developed from MRI data, there is no atlas developed by using functional imaging data, specifically language data, from a sizable disease-specific population.
KEY FINDINGS:
Significantly better spatial agreement with expert-delineated language activations in individual brain tumor patients was found for templates generated from probabilistic language atlas developed by using brain tumor patients compared with a meta-analysis-based template. Probabilities of each activating primary and ancillary languages areas in both hemispheres were determined for clinical language paradigms.
KNOWLEDGE ADVANCEMENT:
Development of probabilistic language atlas based on clinical language fMRIs of brain tumor patients with potential clinical and research applications in language laterality assessment, network categorization and biomarker discovery.
Brain atlases provide a common framework to interpret, communicate, and use large amounts of neuroimaging data after accounting for individual differences.1 Our current understanding of the human brain suggests that structural anatomy alone is insufficient to explain functional characteristics;2 hence, functional atlases play a crucial role in consolidating and advancing current research on brain function.3,4 Clinically, atlases of canonical language or other functional areas have been used for laterality assessment,5 network categorization,6 and biomarker discovery.7 Such applications leverage atlases developed from healthy individuals, though patients with brain diseases have discernible variations in brain anatomy and functions. While disease-specific population-based structural brain atlases have been previously developed from MRI data,8 currently, there is no atlas developed using functional imaging data, specifically language data, from a sizable disease-specific population.
For patients with brain tumors, studies have demonstrated substantial intersubject variation in putative language regions, which can be attributed to tumor infiltration and surrounding edema promoting cortical reorganization and functional displacement.9⇓-11 Thus, straightforward applications of atlases developed using data from healthy individuals may have limited utility in patients with brain tumors. In the past 2 decades, fMRI has emerged as the standard of care in many institutions for localizing eloquent cortices and lateralizing language functions for preoperative planning of brain tumor surgery.12,13 Given the availability of preoperative fMRI data and the use of increasingly standardized procedures,14,15 it is possible to assemble fMRI-based functional atlases that consider the intersubject variations of patients with brain tumors.
Because language is multifaceted (phonologic, semantic, and so forth) and involves a highly complex network of brain areas,16,17 functional mapping results can vary with the language task, task paradigm, and patient performance. For preoperative fMRI, studies have advocated for the use of multiple task paradigms to generate reliable and accurate activation of language networks.18,19 To alleviate widespread variability in clinical practice, the American Society of Functional Neuroradiology recommends standard sets of language paradigms, with the top 2 types of paradigms being sentence completion (SENT) and Silent Word Generation for adult patients.12,15
This study aimed to develop a probabilistic functional brain atlas to consolidate language activations from these 2 types of paradigms in patients with brain tumors. For evaluation, templates of anterior and posterior primary language areas (PLAs) were generated from the atlas and compared with a meta-analysis-based template20 by their spatial similarity with a separate data set of presurgical fMRI studies.
MATERIALS AND METHODS
Subjects
This retrospective study was approved by the institutional review board at our institution, and the requirement for patient informed consent was waived. Initially, 324 patients who had undergone their first standard-of-care presurgical language fMRI between July 18, 2015, and May 13, 2022, were considered. Each fMRI study included at least 1 of the 3 paradigms: SENT, letter fluency (LETT), and category fluency (CAT). Patients with head motion exceeding 2-mm translation or 2° rotation were excluded. In total, 7 patients were excluded due to incomplete data (n = 3) or not having any language fMRI scans that met our head motion criteria (n = 4), leading to 317 included patients (183 men and 134 women; mean age, 51 [SD, 16] years) with 861 fMRI scans for generating the language atlases [Online Supplemental Data] for patient demographics and clinical characteristics). These fMRI scans consisted of SENT from 281 patients (157 men and 124 women; mean age, 50 [SD, 16] years), CAT from 293 patients (169 men and 124 women; mean age, 50 [SD, 16 ] years), and LETT from 287 patients (166 men and 121 women; mean age, 50 [SD, 16] years).
For evaluation, we used a separate fMRI data set from a previous study that included 39 patients with brain tumors (22 men and 17 women; mean age, 48 [SD, 15] years).21 This data set, which includes 38 SENT and 34 LETT fMRI scans, was acquired at our institution using identical acquisition protocols and task paradigms.
Image Acquisition
All MRI scans were performed on 3T clinical scanners (GE HealthCare). fMRI scans were acquired using a T2*WI gradient-echo EPI sequence (TR/TE = 2000 ms/25 ms; flip angle = 90°; parallel imaging acceleration factor = 2; 32 slices with 4-mm thickness and no gap; in-plane resolution = 3.75 × 3.75 mm2; duration = 4 minutes). Anatomic images were obtained using a 3D T1WI inversion recovery–prepared spoiled gradient-echo sequence (TR/TE/TI = 6.1/2.1/400 ms; flip angle = 20°; 1.0 × 1.0 × 1.2 mm3 voxel) and a T2WI FLAIR sequence (TR/TE/TI = 10,000/142/2250 ms; 1.0 × 1.0 × 2.0 mm3 voxel).
Language paradigms included 6 cycles of 20-second control and 20-second task blocks. For SENT, task blocks consisted of incomplete sentences, and patients were tasked to think of a word to fill a blank. For SENT control blocks, patients were shown 4 gibberish sentences in a format resembling that in the active block. For LETT task blocks, patients were shown a letter and tasked to covertly generate words beginning with that letter. For CAT task blocks, patients were shown a category (eg, animals or types of food) and tasked to covertly generate words related to the category. For LETT and CAT control blocks, patients were asked to tap their fingers on their thumb bilaterally. The paradigms were displayed with an MRI-compatible liquid crystal display (SensaVue; Philips Healthcare).
Image Analysis and Atlas Construction
Image analyses were performed using Analysis of Functional Neuro Images (AFNI; http://afni.nimh.nih.gov/afni)22 for individual fMRI analysis except for spatial normalization, SPM12 (https://www.fil.ion.ucl.ac.uk/spm/software/spm12/) for spatial normalization, and in-house Python scripts.23 fMRI preprocessing included motion-correction, slice-timing correction, coregistration with 3D T1WI spatial normalization to Montreal Neurological Institute (MNI) space, and spatial smoothing with an isotropic 6-mm width at half maximum Gaussian kernel. General Linear Model with a canonical hemodynamic response function was used to generate t value activation maps. Significantly activated clusters (P < .05, family-wise error–corrected) were determined using AFNI 3dClustSim to obtain the cluster threshold at the uncorrected cluster-forming threshold of P < .0001. The thresholded t value map was then binarized to form an activation mask for each fMRI scan.
Language atlases for each paradigm were obtained as probabilistic overlap maps (POMs) by adding binary activation masks divided by the number of contributing patients. A probabilistic language atlas was also calculated as a pooled POM by adding all binary activation masks across the 3 paradigms divided by the total number of fMRI scans used.
Probability of fMRI Paradigms Activating Language Areas
Automated Anatomic Labeling Atlas 3 (https://www.gin.cnrs.fr/en/tools/aal/)24 was applied to determine the probability that each fMRI paradigm activated language-related ROIs after spatial transformation to the MNI space25 using Advanced Normalization Tools (http://stnava.github.io/ANTs/).26 The following ROIs were studied (Online Supplemental Data): anterior PLA (aPLA), posterior PLA in the temporal lobe (pPLAT), posterior PLA in the parietal lobe (pPLAP), supplementary motor area (SMA), dorsolateral prefrontal cortex (DLPFC), basal temporal language area (BTLA), and insula. For each paradigm, the probability of detecting activation within each ROI was determined as the percentage of patients having activated clusters overlapping with the ROI.
Comparison with a Meta-Analysis-Based Template
PLA templates from the atlas were generated and compared with a meta-analysis-based language template on the basis of its spatial similarity to fMRI activations in a separate fMRI data set of 39 patients with brain tumors. The templates were generated by constraining the pooled probabilistic language atlas with the anatomic aPLA and pPLAT ROIs described above. The meta-analysis-based language template was obtained from a Neurosynth (https://www.neurosynth.org/) result of 1101 fMRI studies with the same anatomic constraints.20
Details of the separate fMRI data set were described in a previous study.21 Briefly, after standard fMRI processing, 2 board-certified neuroradiologists with expertise in clinical fMRI outlined significantly activated areas in the aPLA (focusing on the posterior inferior frontal gyrus, including the pars triangularis and pars opercularis) and the pPLAT (focusing on the posterior superior temporal gyrus and posterior middle temporal gyrus). Variations in anatomy and fMRI cluster distribution were considered on an individual patient basis. In total, 62 aPLA and 61 pPLAT activation maps were obtained.
The Dice coefficient was used to evaluate the spatial similarity between the templates and the activation maps of the separate patient data sets within the anatomic ROIs of aPLA and pPLAT. We varied the thresholds of the 2 templates at fixed intervals (0.1% for the probabilistic atlas–based template; maximum z score/1000 for the meta-analysis-based template), and Dice coefficients were calculated for each thresholded template. The maximum Dice coefficient across thresholds was used for comparison.
Statistical Analysis
The Wilcoxon signed-rank tests were performed to determine significant differences between templates in the maximum Dice coefficient. Statistical analyses were conducted with scipy.stats.wilcoxon (https://docs.scipy.org/doc/scipy/reference/generated/scipy.stats.wilcoxon.html) (Python 3.8.13, Scipy 1.8.1). A P value < .05 was considered statistically significant.
RESULTS
Language Atlases from Individual Paradigms
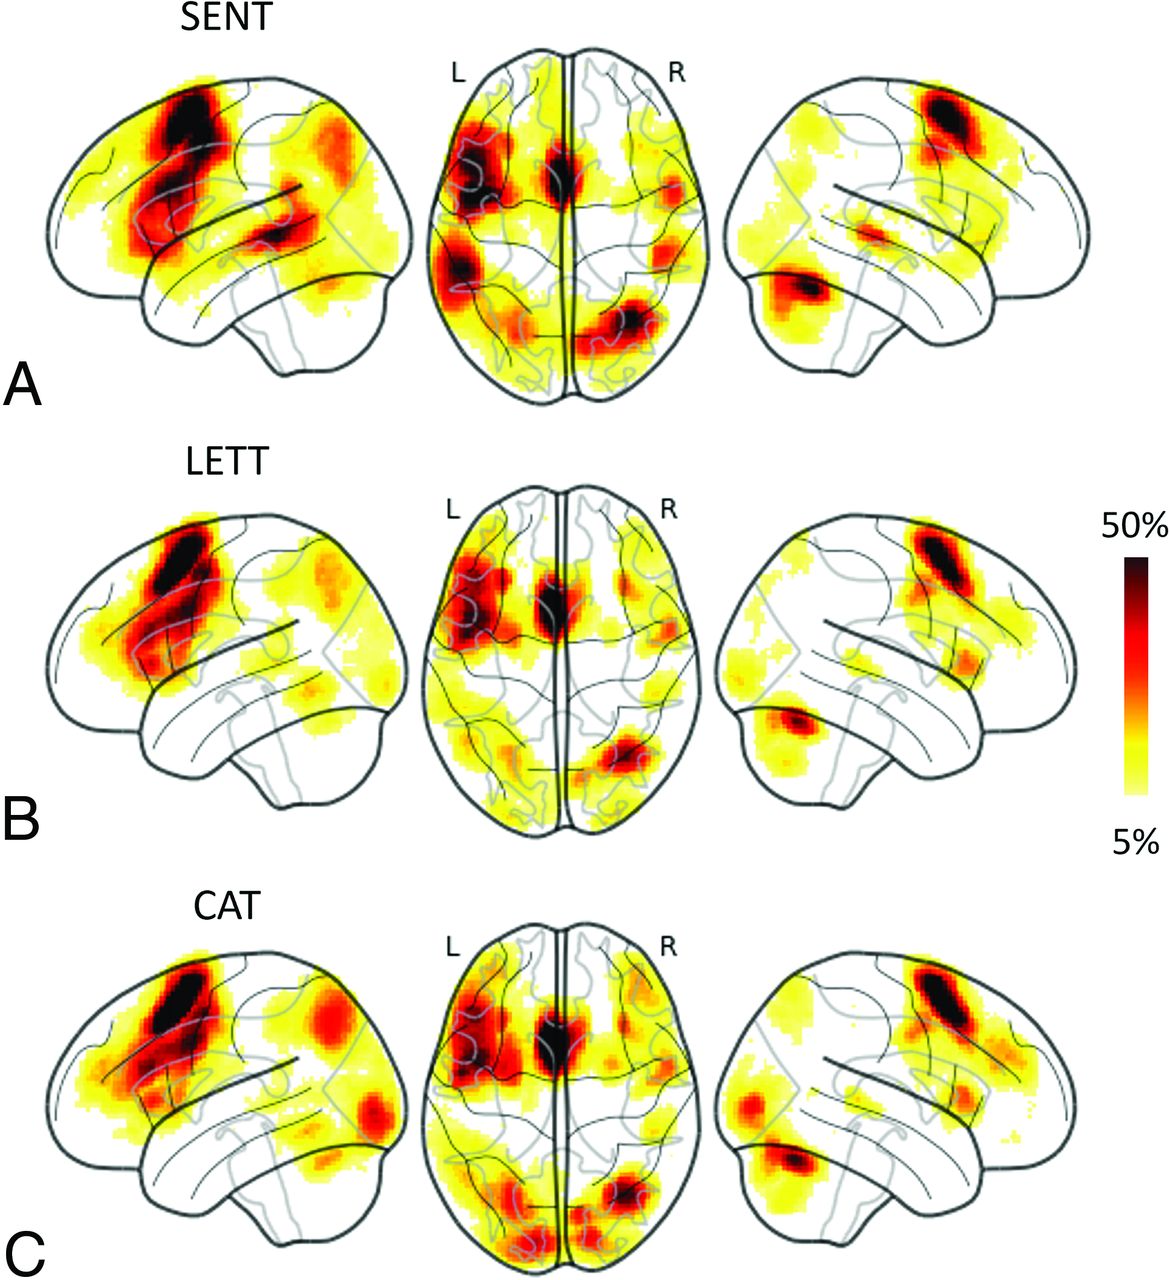
The language atlases from individual paradigms are illustrated in Fig 1. Consistently across the 3 paradigms, the left aPLA, left DLPFC, left SMA, and right cerebellum had a high probability of overlap. Among the 3 paradigms, SENT had voxels with a higher probability of overlap in the left pPLAT (Fig 1A), while CAT had voxels with a higher overlap in the occipital lobe (Fig 1C).

Language functional atlases based on probabilistic overlap maps of individual paradigms. The atlases are presented using glass brain projection (https://nilearn.github.io/dev/modules/generated/nilearn.plotting.plot_glass_brain.html). L indicates left hemisphere; R, right hemisphere.
Probability of fMRI Paradigms Activating Language Areas
The Table presents the probabilities of activating in each of the language-related ROIs with the SENT, LETT, and CAT paradigms. Generally, across the 3 paradigms, greater probabilities of activating in language-related ROIs were found in the left hemisphere than in the right hemisphere. All 3 paradigms had >80% probability of activating areas in the left aPLA, left DLPFC, and left and right SMA, whereas only SENT had >80% probability of activating in the left pPLAT, and only CAT had >80% probability of activating in the right DLPFC. In the left pPLAT and pPLAP, SENT had noticeably higher probabilities (91.5% and 76.9%, respectively) than LETT (74.2% and 53.0%, respectively) and CAT (67.6% and 56.0%, respectively).
| Paradigm | Probability of Activation (%) | |||||
|---|---|---|---|---|---|---|
| SENT | LETT | CAT | ||||
| ROI | L | R | L | R | L | R |
| aPLA | 87.9 | 61.2 | 88.5 | 62.4 | 83.6 | 74.1 |
| pPLAT | 91.5 | 66.9 | 74.2 | 48.8 | 67.6 | 47.8 |
| pPLAP | 76.9 | 39.9 | 53.0 | 30.3 | 56.0 | 39.2 |
| SMA | 90.7 | 84.0 | 91.6 | 90.6 | 94.5 | 90.4 |
| DLPFC | 94.3 | 63.0 | 89.5 | 69.3 | 91.5 | 84.6 |
| BTLA | 68.0 | 65.5 | 55.7 | 57.5 | 68.3 | 63.5 |
| Insula | 59.4 | 43.8 | 65.9 | 51.2 | 59.7 | 52.6 |
Note:— L indicates left hemisphere; R, right hemisphere.
Probability of activation across 3 language paradigms
Probabilistic Language Atlas
The probabilistic language atlas, built on the basis of a pooled POM that consisted of activation maps from 861 language fMRI scans, is presented in Fig 2 as a penetrance map. The left hemisphere had, overall, more extensive and higher overlap probability in the atlas than the right hemisphere. PLAs and ancillary language areas, including aPLA, pPLAT, pPLAP, pre-SMA, DLPFC, BTLA, and insula, were clearly identified with a 5% probability threshold (Fig 2). The regions containing voxels with ≥40% probability of overlap included the left aPLA, left DLPFC, and pre-SMA. Peak probabilities of overlap for the left pPLAT and pPLAp were 24% and 12%, respectively.

Pooled probabilistic language functional atlas presented as a penetrance map overlaid on T1WI standard MNI brain images. Z indicates MNI coordinate of each axial slice in millimeters.
Comparison with the Meta-Analysis-Based Template
Figure 3 presents boxplots comparing the maximum Dice coefficients between the PLA activations of the evaluation of the fMRI data set and the PLA templates derived from the probabilistic language atlas versus the Neurosynth meta-analysis-based results obtained from varying thresholds for the templates. The maximum Dice coefficients for templates derived from the probabilistic language atlas were significantly higher than those for the meta-analysis-based templates both in aPLA (0.351 and 0.326, respectively, P < .05) and in pPLAT (0.274 and 0.244, respectively, P < .005). Figure 4 illustrates the fMRI activations and templates overlaid on T2 FLAIR images of 2 representative patients. Both patients A and B have glioblastoma in the left frontal lobe. At the threshold with a maximum Dice coefficient, the template from the probabilistic language atlas had noticeably better spatial agreement with pPLAT activations in patient A. For patient B, the template derived from the probabilistic language atlas demonstrated better spatial agreement with both aPLA and pPLAT activations.

Boxplots of maximum Dice coefficients for probabilistic language atlas–derived versus Neurosynth-derived templates. Dice coefficients were calculated across thresholds for each template with respect to each individual’s activations in aPLA and pPLAT. The maximum Dice coefficient across thresholds was used to construct the boxplot. Horizontal orange lines indicate median values, and blue dots indicate mean values among subjects (n = 39). Single asterisk, P < . 05; double asterisks, P < . 005.

Sentence-completion fMRI activations and the language templates in aPLA and pPLAT overlaid on T2 FLAIR images of 2 representative patients. Significant fMRI activations (P < .05, family-wise error–corrected) are displayed with color blobs ranging from red to yellow. Green and blue contours outline the probabilistic language atlas– (upper row) and Neurosynth-based (lower row) templates at maximum dice coefficients for the aPLA and the pPLAT, respectively.
DISCUSSION
Language atlases provide templates for quantitative assessment of language mapping, such as localization, lateralization, and strength, as well as for automated detection of language networks with resting-state fMRI.5⇓-7 This study presents the first language atlas built from preoperative fMRI results of patients with brain tumors using the language paradigms similar to those recommended by the American Society of Functional Neuroradiology (ie, SENT and Silent Word Generation).15
Although patients with brain tumors can have discernible intersubject variation in functional activations, language atlases from this study involve many fMRI activations projected onto a standard space. Thus, we were able to reproduce known characteristics of the language network. For example, critical language regions that are commonly assessed clinically, such as the Broca area (aPLA), Wernicke area (pPLAT), angular and supramarginal gyrus (pPLAP), DLPFC, pre-SMA, and BTLA, can be observed.18,27,28 Left-hemisphere dominance is still observed considering the higher probability of overlap in left-hemisphere PLAs and ancillary language areas compared with their right-hemisphere counterparts.27,28
In agreement with the literature, we observed that the semantic task (SENT) was more likely to activate posterior PLAs compared with the 2 Silent Word Generation tasks (CAT and LETT).15,29 This observation can be attributed to sentence-completion tasks being more proficient at activating the posterior language network.29,30 Across all 3 paradigms, the higher probability of overlap in pPLAT compared with pPLAP agrees with a previous study of language regions in presurgical fMRI.18 We also found that the probability of detecting activation in the right DLPFC for the CAT task was higher than for SENT and LETT tasks. This finding can be attributed to more likely recruitment of the right DLPFC for the CAT task, which is corroborated by a separate study on verbal fluency paradigms,31 and to the involvement of the right DLPFC in retrieval tasks.32 The probability of detecting activation in the SMA for both hemispheres was similar across the 3 paradigms, a likely consequence of the intersubject variation during spatial normalization and the 6-mm isotropic smoothing applied during preprocessing. Considering that SMA laterality is known to corroborate language laterality,5 it can still be observed that the spatial extent of SMA activations is asymmetric toward the left hemisphere on the POM.
The pooled probabilistic language atlas developed in this study is equivalent to the weighted average of the 3 language paradigm POMs. Thus, the pooled probabilistic language atlas developed in this study emphasizes areas of activation common across the 3 paradigms. On the basis of use case and context, the pooling strategy and choice of paradigms to include can differ. Thus, we had also created language atlases from single paradigms and made them available. The distinguishing attribute between our language atlases and others developed from healthy individuals is information on intersubject variation. In our atlases, this difference is encapsulated by the spatial extent of the atlas at a specified overlap threshold, with higher thresholds corresponding to a lower tolerance for variation. For example, the spatial extent of areas with higher overlap in the frontal lobe is continuous between the proximally close aPLA and DLPFC in the left hemisphere and can be attributed to using a population of patients with brain tumors for atlas building; these patient populations are heterogeneous in terms of functional anatomy.9 Given the implementation of the POM methodology, sources of intersubject variation taken into consideration include intrinsic variation, normalization imprecision due to lesion-distorted anatomy, and functional reorganization due to tumor invasion.
We compared our results with those of Neurosynth because it is a widely-referenced large-scale platform for automated synthesis of fMRI data. The Neurosynth result is a statistical inference map generated using a χ2 test of independence and informs if coordinates of a voxel have been reported more consistently in studies involving the term “language” than in studies that did not.20 Therefore, it allowed us to calculate Dice coefficients in a similar fashion among varying thresholds to ensure a fair comparison. The comparison demonstrated that our templates had better agreement with individual patient’s fMRIs. This outcome may be attributed to the Neurosynth meta-analysis including fMRI studies with different cohorts, primarily healthy individuals, various task and resting-state fMRI paradigms, and different acquisition and analysis methods, whereas our atlas was built from a uniform source of fMRI data. In addition, for patients with brain tumors, the position of a tumor with respect to the classic/principal functional anterior Broca and posterior Wernicke areas can influence the locoregional functional reorganization. Given the large group of patients included in the study, it is possible that filtering for contributing patients with similar tumor locations (eg, anterior or posterior) during atlas development may allow better spatial agreement with the evaluation data set.
We envision our atlas as having potential clinical and research applications through the derivation of templates for ROIs. An example would be language assessment of patients with brain tumors in which templates of functional ROI atlases based on healthy individuals are often used to calculate the laterality index. Templates generated from our atlas account for functional anatomy distortions due to the tumor, which may improve the fidelity of the calculated laterality index.5,33 Another potential application is in imaging biomarker studies, wherein postwarping of primary and ancillary language areas into patient space, templates from our atlas can serve as language localizers for quantifying imaging measures, whether from fMRI activations of more specific paradigms, or different MRI sequences, or different imaging modalities.34,35 Our atlas could also be used to guide resting-state fMRI template matching for detecting language networks.6,36 These applications could rely on manual delineation of language areas by experts, but atlases help to make the process automated and less operator-dependent. The potential clinical implications of this study will depend on the improvement with each different use of the atlas, eg, more accurate assessment of language lateralization, imaging biomarker quantification, and resting-state fMRI language mapping. Further validation studies and clinical trials may be needed to assess the practicality and effectiveness of the atlas in clinical settings. Although the existence of large lesions and distorted anatomy may introduce the potential inaccuracy of spatial registration,37 recent studies have demonstrated that such errors are reduced with more modern deformable registration methods, allowing reasonably good performance even in patients with brain tumors.38 In addition, for large ROIs such as PLAs, the misregistration may remain local and its effect would be specific to applications (eg, laterality calculation, biomarker quantification, template matching). If the ROI is far from the tumor, eg, using the aPLA atlas to calculate the laterality index for a patient’s tumor near the pPLA, the effect of spatial registration should be minimum. If the use of an atlas directly focuses on the language ROI covering/adjacent to lesions, we would recommend that the users inspect the registration closely. Again, because the ROIs have large spatial extents, the overall effect may not be significant. However, when there are concerns, one can consider extending the ROIs by applying a lower probability threshold on the atlas. This is one of the advantages of the probabilistic atlas.
This study has some limitations. First, this is a single-institution study with MRI data gathered from limited scanner platforms. The data set reflects the typical patient population undergoing presurgical fMRI in our institution. Including data from other institutions, which would incorporate more diverse patient cohorts and/or fMRI paradigms/methods, could further refine the atlas. In parallel, multicenter studies have shown that fMRI data acquired on different scanners will have different activation effect sizes and spatial smoothness.39 This result may impact the atlas on areas with lower overlap probabilities (extents). However, we expect the central tendencies of high-overlap probabilities to remain similar, and corresponding brain regions identified in our atlas would still be useful for appropriate language-related analyses. Second, our atlas was developed using only data from patients with brain tumors. However, a substantial portion of presurgical fMRI studies are performed for patients requiring brain tumor resection.40 Third, only clinical language generation (LETT and CAT) and semantic paradigms (SENT) were used to develop the atlas. Thus, the functional anatomy typically recruited in these tasks is emphasized in our atlas. Other fMRI task paradigms may yield different weightings in language areas and may involve additional brain regions. The potential implications of this variation would likely depend on its application and whether the weights and the additional regions are used, eg, for assessing language lateralization or for assisting resting-state fMRI analysis.
CONCLUSIONS
We have developed probabilistic language atlases comprising 861 presurgical language fMRI scans from 317 patients with brain tumors. Three paradigms were used in our study, and probabilities of each activating primary and ancillary languages areas in both hemispheres were determined. We found significantly better spatial agreement with expert-delineated language activations in individual patients for the PLA templates generated from our atlas compared to a meta-analysis-based template.
Footnotes
This study was supported by the National Institutes of Health/National Cancer Institute under award No. R01 CA258788 and P30 CA016672. Editorial support was provided by Research Medical Library at University of Texas MD Anderson Cancer Center.
Disclosure forms provided by the authors are available with the full text and PDF of this article at www.ajnr.org.
References
- 1.
- 2.
- 3.
- 4.
- 5.
- 6.
- 7.
- 8.
- 9.
- 10.
- 11.
- 12.
- 13.
- 14.
- 15.
- 16.
- 17.
- 18.
- 19.
- 20.
- 21.
- 22.
- 23.
- 24.
- 25.
- 26.
- 27.
- 28.
- 29.
- 30.
- 31.
- 32.
- 33.
- 34.
- 35.
- 36.
- 37.
- 38.
- 39.
- 40.
- Received March 1, 2024.
- Accepted after revision June 9, 2024.
- © 2024 by American Journal of Neuroradiology