Abstract
BACKGROUND AND PURPOSE: Prior large prospective studies have shown 2D synthetic MR image quality to be similar to that of conventional MR imaging across a wide variety of normal and abnormal subjects. This study is the first large, prospective comparison of 3D synthetic to conventional MR imaging performed in routine clinical settings.
MATERIALS AND METHODS: A prospective, multicenter, multireader clinical investigation to evaluate the diagnostic performance of 3D synthetic images based on the novel synthetic MRI 3D-QALAS method compared with conventional 3D MRI was performed. Five blinded neuroradiologists evaluated the 3D synthetic and conventional MR images of 189 subjects who presented at clinical sites for neuroimaging. The objectives were to compare sensitivity and specificity of pathologic findings, accuracy of imaging findings, image quality, legibility of anatomic structures, artifact prevalence, and interrater and intermethod agreement of synthetic 3D MR images with conventional 3D images.
RESULTS: Both sensitivity and specificity of 3D synthetic and conventional images for pathologic findings and diagnostic accuracy of radiologic findings were very similar, 66/68% and 85/85%, respectively. The individual values for the readers varied between 58%–73%/58%–75% for sensitivity and 72%–98%/77%–94% for specificity. No significant difference could be determined between the methods. Ratings (1–5 scale) of synthetic MR image quality were higher than for T1-weighted images (mean score of 4.6 ± 0.6, with 98.6% having a 3 or higher versus 4.5 ± 0.7, with 97.8% having a 3 or higher) and T2-weighted images (4.4 ± 0.7, with 98.0% having a 3 or higher versus 4.2 ± 0.8, with 97.5% having a 3 or higher).
CONCLUSIONS: In this study no significant differences were found in the sensitivity and specificity of pathologic findings and accuracy of imaging findings between 3D synthetic T1-weighted and T2-weighted images and 3D conventional images. In addition, 5 blinded neuroradiologists rated 3D synthetic MR images of higher image quality than conventional 3D images.
ABBREVIATIONS:
- 3D-QALAS
- 3D-quantification by using an interleaved Look-Locker acquisition sequence with a T2 preparation pulse
- DESPOT
- Driven Equilibrium Single Pulse Observation of T1
- GEE
- generalized estimating equations
- MDME
- Multi-Dynamic Multi-Echo
The ability to objectively measure the MRI physical properties of a patient has improved tremendously over recent years. Tissue properties can now be evaluated directly by using quantitative MRI maps of the longitudinal R1 relaxation rate (inverse of T1 relaxation time), the transverse R2 relaxation rate (inverse of T2 relaxation time) and proton density. Various methods, such as Multi-Dynamic Multi-Echo1 MR fingerprinting,2 driven equilibrium single pulse observation (DESPOT),3 and, more recently, 3D-quantification by using an interleaved Look-Locker acquisition sequence with a T2 preparation pulse (3D-QALAS)4,5 can be used to obtain quantitative maps. Rather than subjectively rating image intensity contrast between tissues, quantitative MRI provides absolute measures, thereby improving the precision of distinction between normal and pathologic tissue types.6 Maps only, however, have limited value without associated clinical interpretation. More clinical value is possible with tissue characterization and volume segmentation based on SyMRI (SyntheticMR AB, Sweden).7,8 Synthetic MRI adds clinical value by converting maps into more familiar conventional appearing images. In synthetic MRI, the R1, R2 and proton density maps are used as input to calculate the expected signal intensity of MR images with a given set of TE, TR and possibly a TI. This way a conventional T1-weighted (short TE and TR) and T2-weighted (long TE and TR) can be generated without individual acquisitions.9 Synthetic MRI therefore provides the standard images, as well as quantified maps and segmentation volumes, all based on a single, short acquisition. As neuroradiology moves toward increased use of 3D imaging, 3D MR quantification methods that allow isotropic resolution are becoming of higher interest. The aim of this prospective, multicenter, multireader clinical investigation was to evaluate the diagnostic performance of synthetic images based on the novel 3D-QALAS method compared with conventional 3D MRI. The objectives were to compare sensitivity and specificity of pathologic findings, accuracy of imaging findings, image quality, legibility of anatomic structures, artifact prevalence, and interrater and intermethod agreement of synthetic 3D MR images with conventional 3D images.
MATERIALS AND METHODS
Subjects
The number of subjects in the study was 189, with 126 adults (18 years and older) and 63 children. The mean age was 35 ± 23 years old, ranging from 0 to 64 years. Of this group 103 (54.5%) were diagnosed with pathology and 86 (45.5%) were reported as normal by the providing original site (62/64 for the adults and 41/22 for the children). Pathologies comprised of congenital malformations (13), infectious/inflammatory/demyelinating diseases (20), intracranial neoplasms (27), traumatic lesions (4), vascular disorders (26), and neurodegenerative disorders and hydrocephalus (13). The diagnosis from the providing site was considered as ground truth. Governing ethics committees at each site approved the study and all subjects provided written informed consent. For the children included in the study, the parent(s) or guardian provided permission, with the assent of the child when appropriate.
Image Acquisition
Image data sets were obtained from 6 different sites, inevitably leading to small variations in the scanner settings. The FOV was 240–256 mm, the resolution was 1.0 or 1.2 mm isotropic. For 3D-T1-weighted, a gradient-echo acquisition was used with TE/TR = 3/6 ms, by using a scan time 3–6 minutes. For the 3D-T2-weighted, a turbo-spin-echo acquisition was used with TE/TR = 300/2500 ms with echo-train length >100, by using a scan time of 2–4 minutes. The 3D-QALAS sequence was a segmented gradient-echo sequence interleaved with R1 and R2 sensitizing phases to simultaneously obtain R1 and R2 relaxation and proton density, described by Kvernby et al.4 The TE/TR = 2.3/5.0 ms. The scan time was 5–6 minutes. All data were acquired on 3T scanners (Philips Healthcare, Best, the Netherlands). A full list of acquisition details is provided in Table 1.
Sequence details of the 6 participating sites
Radiologic Assessment
Image data were processed by using SyMRI 15 (SyntheticMR AB, Linköping, Sweden) to generate synthetic T1-weighted and T2-weighted image stacks. The synthetic settings were TE/TR =10/650 ms for T1-weighted and TE/TR/TI =100/6000/150 ms for T2-weighted. The synthetic and conventional data sets of the 189 subjects were randomized and provided to 5 independent, blinded neuroradiologists, resulting in 945 cases in a first round and, after a memory washout period of at least 4 weeks, 945 cases in a second round. The radiologists were asked to determine pathologies or rate the subject as normal. Furthermore, the legibility of 6 small structures, the central sulcus, cerebral peduncle, cervicomedullary junction, head of caudate nucleus, middle cerebellar peduncle, and the posterior limb of internal capsule was evaluated. In case of an artifact the radiologists could comment and describe it. Lastly, the radiologist assessed the image quality on a scale from 1 to 5 (1 = Unacceptable, 5 = Excellent).
Statistical Analysis
The sensitivity of pathologic findings was defined as the number of found pathologies as a fraction of the number of ground truth pathologies (true-positives), the specificity of pathologic findings was the number of found normals as a fraction of the ground truth normals (true-negatives) and the diagnostic accuracy of radiologic findings was defined as the number of correctly determined radiologic findings (both pathologies and normal). Analyses of binary variables were performed by using generalized estimating equations (GEE), accounting for repeated measures (ie, by multiple readers) on the same subject. The response variable was the difference between synthetic and conventional MR images, calculated for each patient and reader. GEE was implemented by using a (working) normal distribution, identity link, and patient as subject effect to account for within-patient correlations. Robust standard errors were used to account for violations against distributional assumptions. The model included an intercept as the sole fixed effect, which is an estimator for the mean difference between synthetic and conventional MR images. The image quality score was evaluated by using linear mixed effects models with patient and reader as crossed random effects, and otherwise implemented similarly to the GEE analyses above. Intermethod and interrater agreement were evaluated by using overall agreement. Confidence intervals were calculated by using nonparametric block bootstrap.
RESULTS
The comparison between synthetic MR images and conventional MR images with respect to sensitivity of pathologic findings, specificity of pathologic findings and diagnostic accuracy of radiologic findings are listed in Table 2. Both sensitivity and specificity for synthetic and conventional images were very similar, 66/68% and 85/85% respectively, for the full data set. The individual values for the readers varied between 58%–73%/58%–75% for sensitivity and 72%–98%/77%–94% for specificity. No significant difference could be determined between the methods.
Comparison between synthetic MR images and conventional MR images with respect to sensitivity of pathologic findings, specificity of pathologic findings, and diagnostic accuracy of radiologic findings of the full analysis set, adult subpopulation, and pediatric subpopulation
In Table 3 the confusion matrix is displayed for the overall findings to compare the predetermined diagnosis to the one made by the participating radiologists on synthetic and conventional images. For the full analysis data set of the synthetic images 342 pathologic cases of 515 (5 × 10³) were confirmed as pathologic and 367 normal cases of 430 (5 × 86) were confirmed as normal. For conventional images this was 348 and 366, a difference of +6 and −1, respectively. For the synthetic images, in 173 cases existing pathology was not found. For conventional images, this was in 167 cases (−6). More details are provided in Table 4 where the confusion matrix is shown, specified for the various disease types. The highest values are on the diagonal, where the predetermined diagnosis matches the diagnosis found during the reading study. There are, however, specific areas where confusion is higher, such as that intracranial neoplasms are diagnosed as traumatic lesions, or that vascular disorders are regarded a neurodegenerative or vice versa. This is similar for synthetic and conventional images.
Confusion matrix for the pathologic findings for the full analysis data set, adult subpopulation, and pediatric subpopulation, where the predetermined diagnosis of pathology/no pathology is compared with diagnosis of the participating radiologists on synthetic and conventional images
Confusion matrix for radiologic findings on the full analysis set, where the predetermined specific diagnoses are compared with the diagnoses of the participating radiologists on synthetic and conventional images
The images of the study were rated for image quality on a of scale 1–5, where 1 is unacceptable and 5 is excellent. The results are listed in Tables 5 and 6. The synthetic T1-weighted images had a mean score of 4.6 ± 0.6, with 98.6% having a 3 or higher. The conventional T1-weighted images had a mean score of 4.5 ± 0.7, with 97.8% having a 3 or higher. For the T2-weighted images this was 4.4 ± 0.7, with 98.0% having a 3 or higher and 4.2 ± 0.8, with 97.5% having a 3 or higher. Hence, in both cases the synthetic images scored better than the conventional ones. In Fig 1 the results are graphically displayed. Examples of synthetic and conventional images are provided in Figs 2–4. The reported artifacts in the images concerned motion, flow ghosts, magnetic susceptibility, low resolution, low SNR, and low tissue contrast. For the T1-weighted images significantly higher values of flow ghosts, low resolution, low SNR, and low tissue contrast were reported for conventional images. For the T2-weighted images significantly higher values of flow ghosts and low SNR were reported for conventional images, whereas significantly higher values of low resolution and low tissue contrast were reported for the synthetic images. The legibility of the 6 small structures was rated as sufficient in >98% of all image data sets.

Stacked bar chart of the image quality rating of synthetic and conventional T1-weighted and T2-weighted images. Total number of data sets is 189, viewed by 5 radiologists.

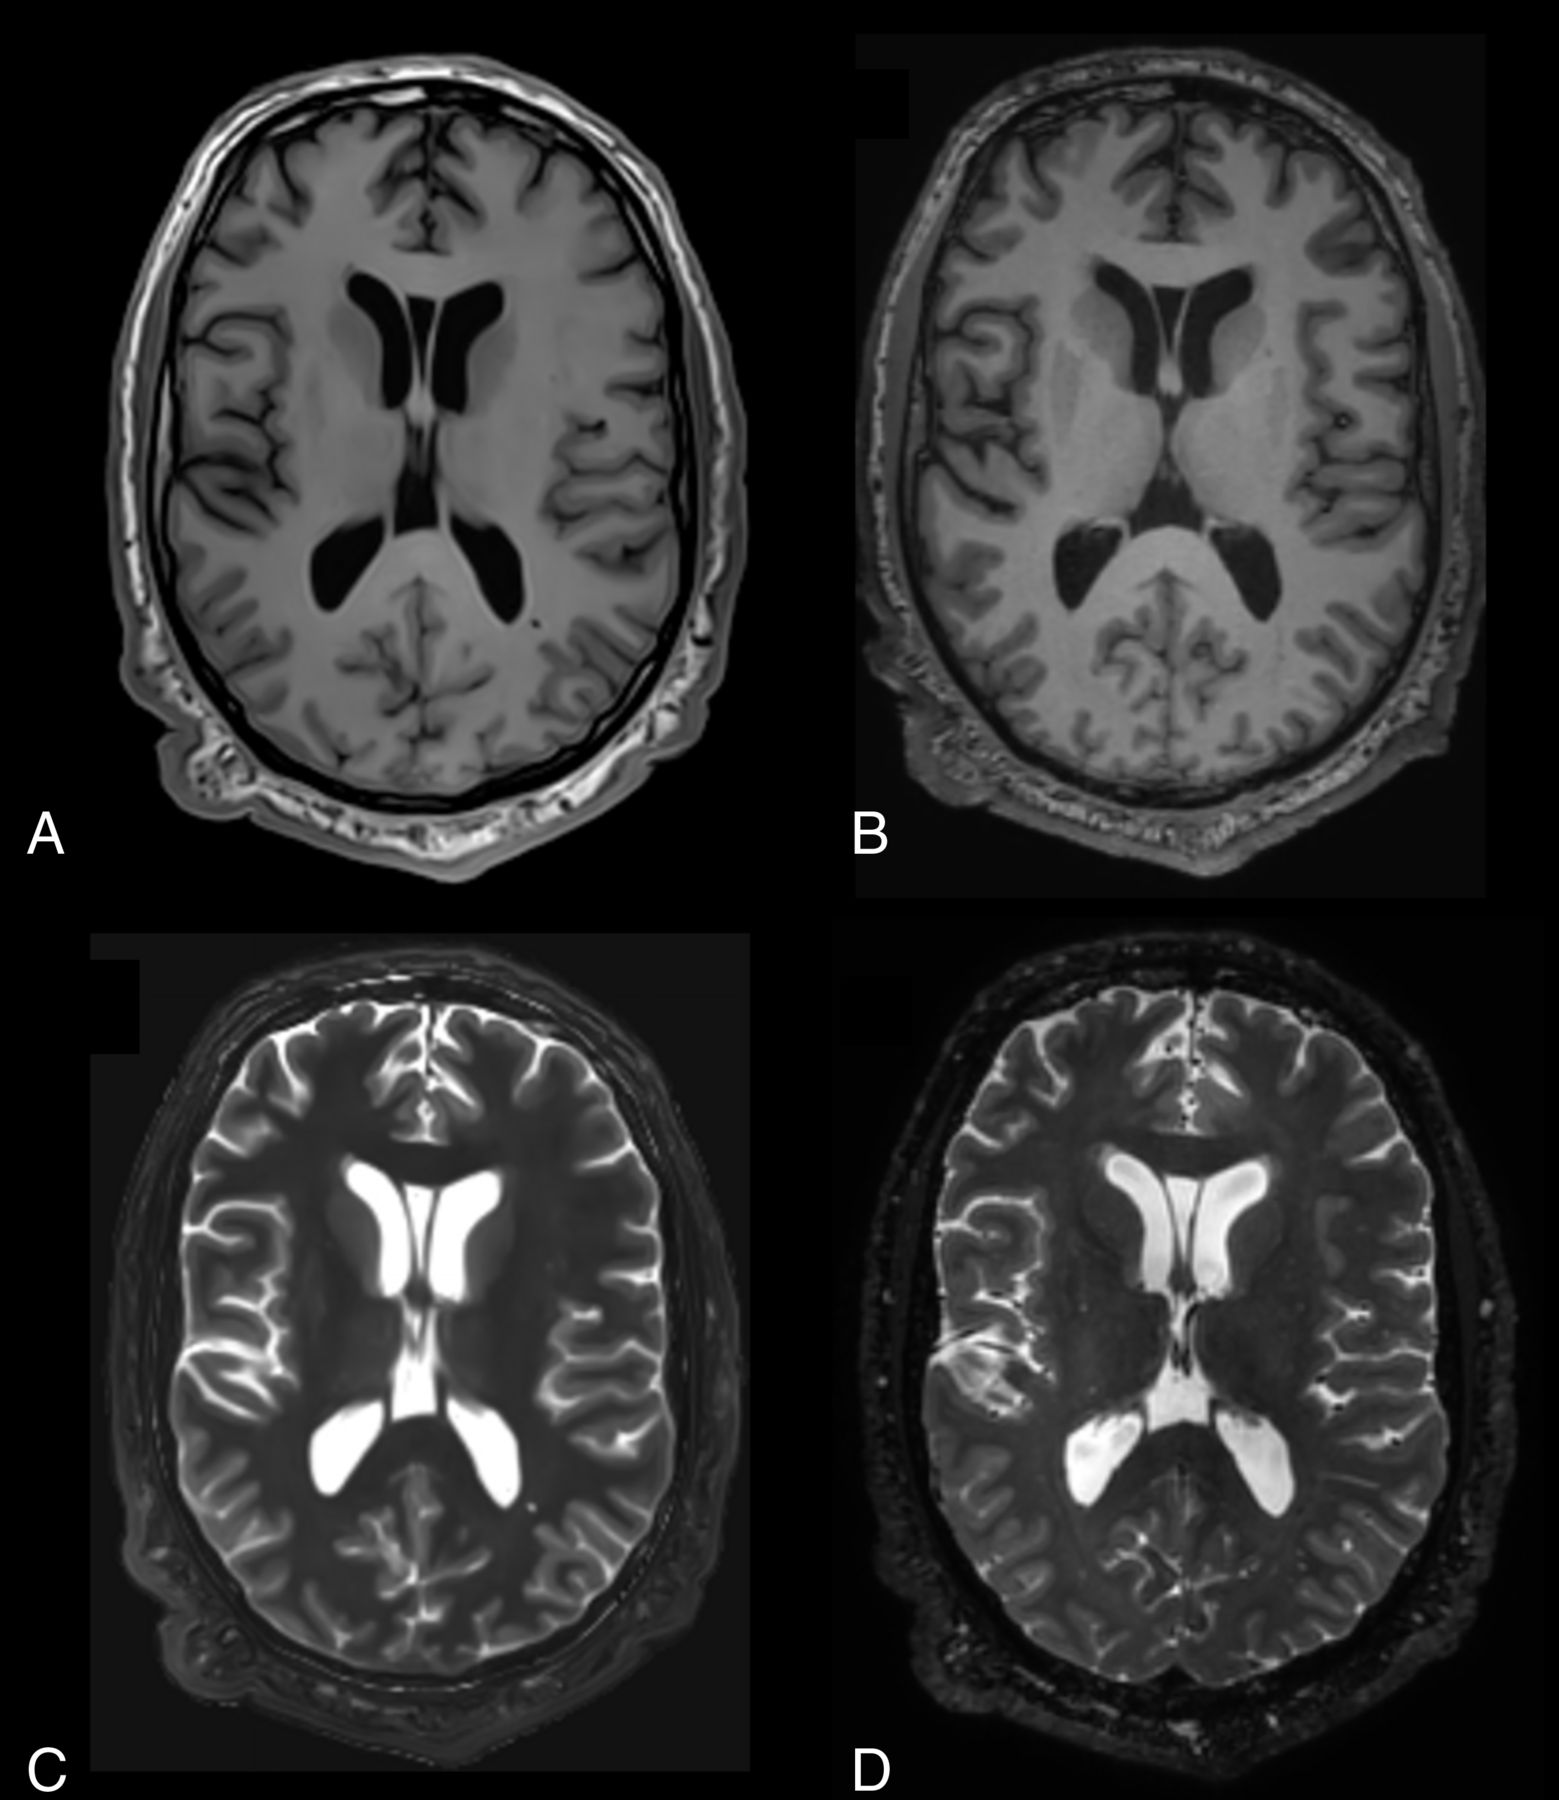
Example of synthetic and conventional images of a patient diagnosed with intracranial neoplasm but rated as normal/normal/congenital malformations/intracranial neoplasms/normal by the five radiologist. A, Synthetic T1-weighted. B, Conventional T1-weighted. C, Synthetic T2-weighted. D, Conventional T2-weighted.

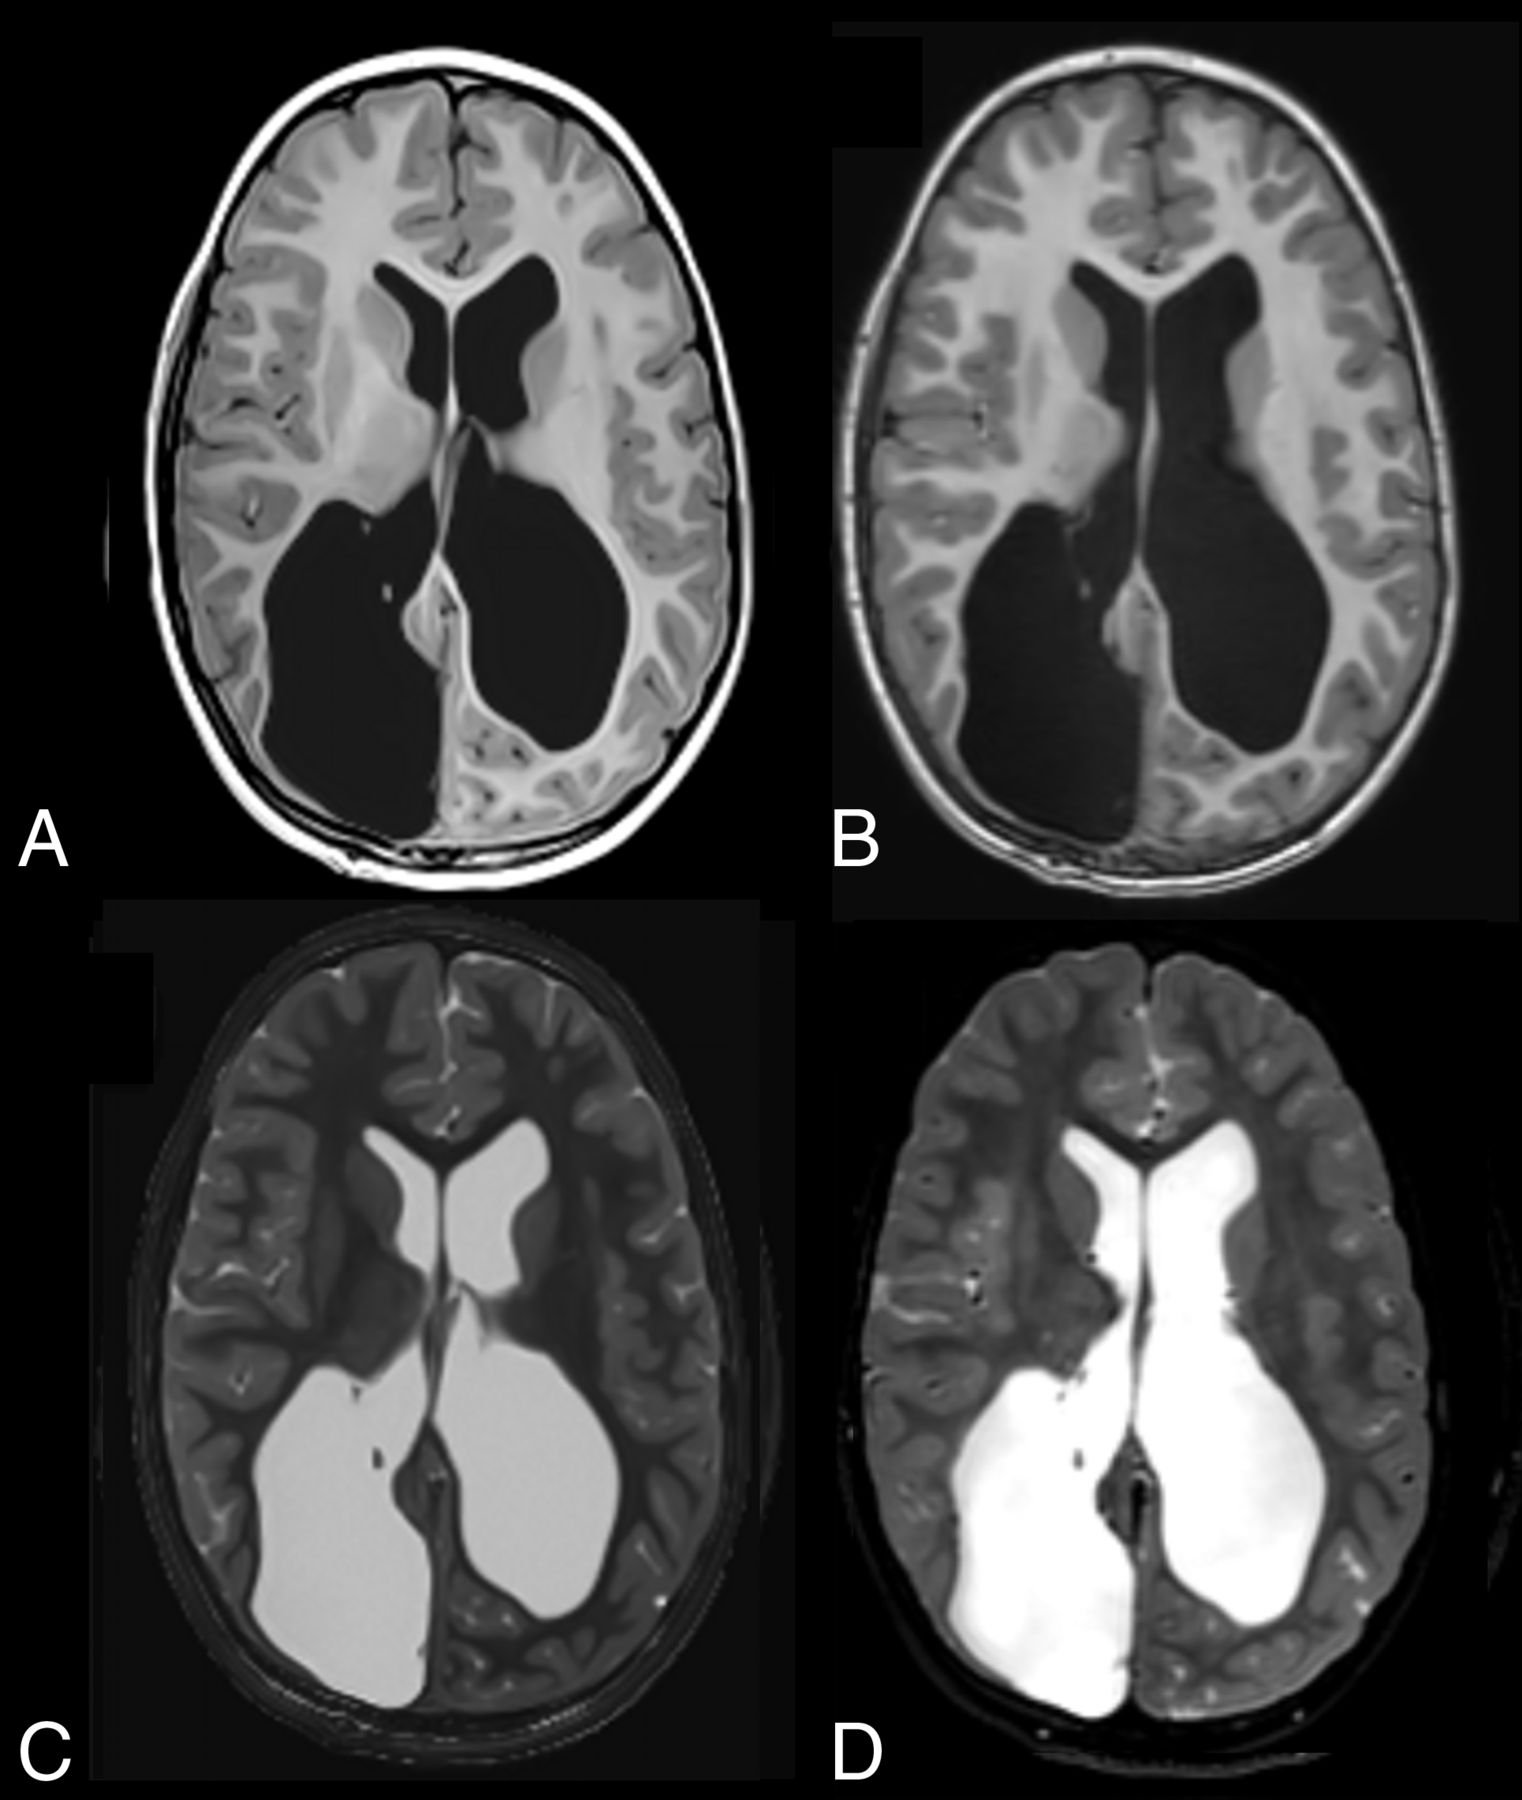
Example of synthetic and conventional images of a patient diagnosed with vascular disorders of the brain, rated as vascular disorders/neurodegenerative disorders and hydrocephalus/neurodegenerative disorders and hydrocephalus/vascular disorders/vascular disorders. A, Synthetic T1-weighted. B, Conventional T1-weighted. C, Synthetic T2-weighted. D, Conventional T2-weighted. E, Synthetic T1-weighted. F, Conventional T1-weighted. G, Synthetic T2-weighted. H, Conventional T2-weighted.

Example of synthetic and conventional images of a pediatric patient diagnosed with neurodegenerative disorders and hydrocephalus, rated as such by all readers. A, Synthetic T1-weighted. B, Conventional T1-weighted. C, Synthetic T2-weighted. D, Conventional T2-weighted.
Comparison between synthetic MR images and conventional MR images with respect to image quality for the T1-weighted images
Comparison between synthetic MR images and conventional MR images with respect to image quality for the T2-weighted images
The intermethod agreement for pathology finding on the full analysis set was 0.86 (95% CI, 0.83–0.88), which was higher than the interrater agreement on synthetic images, 0.82 (0.79–0.86) and on conventional images, 0.82 (0.78–0.85). The same result was observed for radiologic finding class; the intermethod agreement was 0.75 (0.72–0.78), which was higher than the interrater agreement on synthetic images, 0.67 (0.62–0.71) and on conventional images, 0.67 (0.62–0.71).
DISCUSSION
Previous studies on 2D synthetic MRI mainly focused on their comparative image quality and diagnostic capabilities compared with conventional 2D MRI sequences obtained in a clinical neuroimaging cohort.10⇓⇓–13 In the largest of these studies, the diagnostic performance of 2D synthetic imaging was similar to that of conventional MRI, as indicated by statistical noninferiority of synthetic images.10 Since this prior study of 2D synthetic MR, 3D synthetic MR techniques have become available. Given that routine clinical neuroimaging protocols now more commonly incorporate 3D sequences and have become more foundational to clinically adjacent aspects of routine practice (multiplanar reconstructions, structural reference for DTI/fMRI, input for neuronavigational systems, etc) and quantitative analysis (volumetrics), a comparative study of conventional and synthetic MR is of clinical value. This study is the first to investigate the diagnostic power of 3D synthetic images in a clinical neuroimaging cross-sectional cohort. The sensitivity and specificity of pathologic findings and accuracy of imaging findings were used to compare 3D synthetic and conventional images of the brain. The sensitivity of pathologic findings (true-positives) was equal for both 3D methods (66% synthetic/68% conventional) and slightly higher than reported in prior 2D studies (56% synthetic/60% conventional).10 This is detailed in the confusion matrices in Tables 3 and 4. Relatively large numbers of existing pathologies were not found, 173 for the synthetic images and 167 for the conventional images, more than one-third of the cases. This is, however, likely related to the fact that in the study neuroradiologists did not have access to the patient’s clinical history, reason for examination, or prior images and reports when assessing the images. For example, subjects with prior gross total tumor resections may have a pathology classification by the original site as tumor, while the study neuroradiologists labeled the images with a different pathology not knowing the patient history. On the other hand, study neuroradiologists may have interpreted incidental findings as definite pathologies while the original site may have classified them as normal. These observations were in many cases remarked on in the comment field of the study but are not visible in the outcome. Given the study design, which attempted to as closely as possible mimic routine clinical neuroimaging, the study sensitivity and specificity are well within known reported ranges for MR imaging in neuroradiology (39%–98% and 33%–100%, respectively), with variability based on reader knowledge and experience in the pathologies studied.14⇓–16
The intermethod agreement on pathology findings was higher than the interrater agreement, suggesting that the participating radiologists were more consistent on either method than with each other. The specificity of pathologic findings (true-negatives) was higher (85/84%) than the sensitivity. The accuracy of radiologic findings is also relatively low (60/60%), but again, Table 4 provides an explanation that some pathologies can easily be interchanged when no clinical history or prior comparison examinations are provided. There is no suggestion in the data that the method itself, synthetic or conventional imaging, could have affected this result. The synthetic images do get higher scores on image quality than the conventional ones (4.6/4.5 for T1-weighted and 4.4/4.2 for T2-weighted). Yet, 13 synthetic T1-weighted and 21 conventional T1-weighted images of 945 (1.4% and 2.2%, respectively) received a poor or unacceptable rating. For T2-weighted this was 19 and 24 or 2.0% and 2.5%, respectively.
A limitation of the study was that all data were collected on a single scanner vendor and all at 3T. However, it is likely that the comparative outcomes would be similar on other vendor scanners and field strengths because both synthetic and conventional image quality would be similarly affected by individual scanner technical capabilities (ie, field strength, head coil, magnet homogeneity, acceleration factors, etc.). Further studies are required to investigate this. There is also a possibility that the readers, although blinded for the method, could recognize the imaging technique they were utilizing. Furthermore, the participating readers were provided with less clinical information than the subject site of origin, such as clinical indication, patient history, and other typical sequences like diffusion-weighted, susceptibility-weighted, or postcontrast imaging. This may have affected the outcome, but it should have the same effect on synthetic and conventional images. On the other hand, given the variability in the quality and or usefulness of clinically obtainable patient history, the lack of this information in this study may actually have limited a potential source of bias based on a participating site’s thoroughness in extracting applicable clinical information/data for the study readers. Another limitation was that only T1-weighted and T2-weighted images were assessed, whereas synthetic MRI allows generating any combination of TE, TR, and TI, thereby creating other image contrasts such double inversion recovery and phase-sensitive inversion recovery by using the same acquisition data. Previous studies have shown their value17,18 and potentially they could further improve the quality of reading when added.
CONCLUSIONS
This study is the first large multicenter, multireader investigation of the diagnostic power of 3D synthetic images in a clinical neuroimaging cross-sectional cohort that extends prior similar results obtained in a cross-sectional neuroimaging cohort comparison of 2D synthetic and conventional MR imaging. No significant differences were found in the sensitivity and specificity of pathologic findings and accuracy of imaging findings between 3D synthetic T1-weighted and T2-weighted images and 3D conventional images. In addition, 5 blinded neuroradiologists rated 3D synthetic MR images of higher image quality than conventional 3D images.
Footnotes
Disclosure forms provided by the authors are available with the full text and PDF of this article at www.ajnr.org.
References
- 1.
- 2.
- 3.
- 4.
- 5.
- 6.
- 7.
- 8.
- 9.
- 10.
- 11.
- 12.
- 13.
- 14.
- 15.
- 16.
- 17.
- 18.
- Received September 16, 2024.
- Accepted after revision November 21, 2024.
- © 2025 by American Journal of Neuroradiology