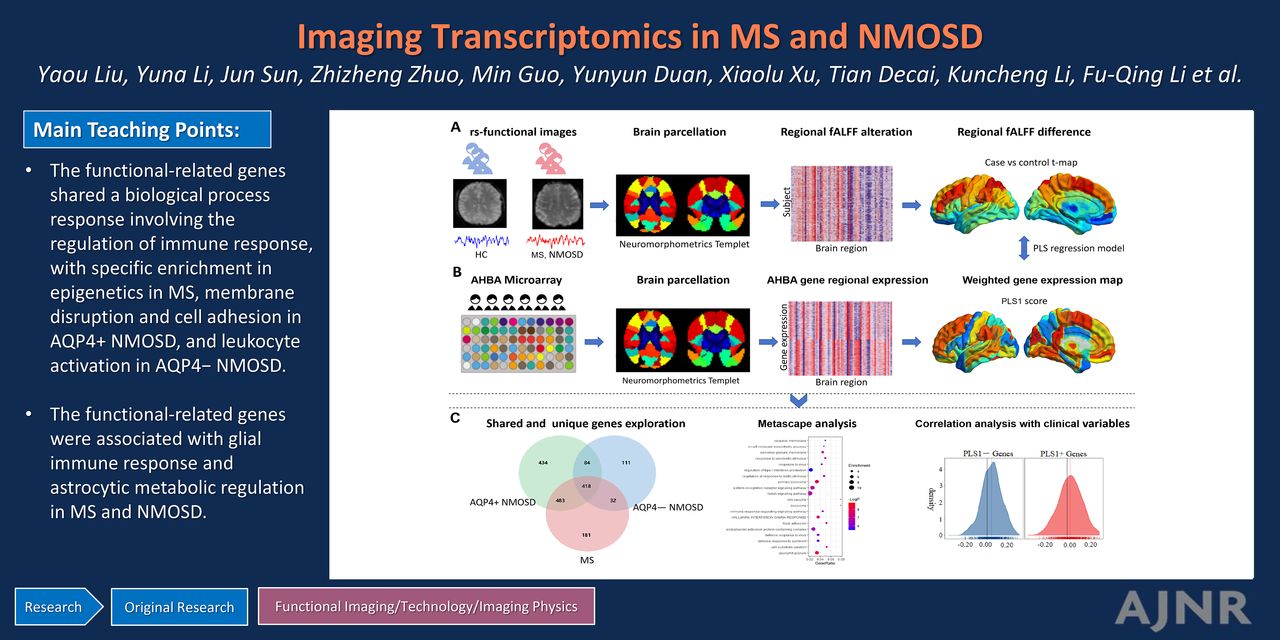
Graphical Abstract

Abstract
BACKGROUND AND PURPOSE: The underlying transcriptomic signatures driving brain functional alterations in MS and neuromyelitis optica spectrum disorder (NMOSD) are still unclear.
MATERIALS AND METHODS: Regional fractional amplitude of low-frequency fluctuation (fALFF) values were obtained and compared among 209 patients with MS, 90 patients with antiaquaporin-4 antibody (AQP4)+ NMOSD, 49 with AQP4− NMOSD, and 228 healthy controls from a discovery cohort. We used partial least squares (PLS) regression to identify the gene transcriptomic signatures associated with disease-related fALFF alterations. The biologic process and cell type–specific signature of the identified PLS genes were explored by enrichment analysis. The correlation between PLS genes and clinical variables was explored. A prospective independent cohort was used to validate the brain fALFF alterations and the repeatability of identified genes.
RESULTS: MS, AQP4+ NMOSD, and AQP4− NMOSD showed decreased fALFF in cognition-related regions and deep gray matter, while NMOSD (both AQP4+ and AQP4−) additionally demonstrated lower fALFF in the visual region. The overlapping PLS1− genes (indicating that the genes were overexpressed as regional fALFF decreased) were enriched in response to regulation of the immune response in all diseases, and the PLS1− genes were specifically enriched in the epigenetics profile in MS, membrane disruption and cell adhesion in AQP4+ NMOSD, and leukocyte activation in AQP4− NMOSD. For the cell type transcriptional signature, microglia and astrocytes accounted for the decreased fALFF. The fALFF-associated PLS1− genes directly correlated with Expanded Disability Status Scale of MS and disease duration across disorders.
CONCLUSIONS: We revealed the functional activity alterations and their underlying shared and specific gene transcriptional signatures in MS, AQP4+ NMOSD, and AQP4− NMOSD.
ABBREVIATIONS:
- AHBA
- Allen Human Brain Atlas
- AQP4
- antiaquaporin-4 antibody
- EDSS
- Expanded Disability Status Scale
- fALFF
- fractional amplitude of low-frequency fluctuation
- FDR
- false discovery rate
- GO
- gene ontology
- HC
- healthy controls
- KEGG
- Kyoto Encyclopedia of Genes and Genomes
- NMOSD
- neuromyelitis optica spectrum disorder
- PASTA
- Paramedic Acute Stroke Treatment Assessment
- pFDR
- P value with false discovery rate corrected
- PLS
- partial least squares
- rsfMRI
- resting-state fMRI
MS and neuromyelitis optica spectrum disorder (NMOSD, including antiaquaporin-4 antibody-positive [AQP4+] and antiaquaporin-4 antibody-negative [AQP4−] subtypes) are recognized as inflammatory demyelination disorders of the CNS,1,2 with overlapping clinical symptoms but distinct genetic and neuropathophysiological features.3⇓-5 Brain functional deficits in MS and NMOSD are crucial for diagnosis and for predicting physical disability and cognitive impairment.6,7
Fractional amplitude of low-frequency fluctuations (fALFF) is a commonly used resting-state fMRI (rsfMRI) metric, which reflects neural activity strength on a voxel-by-voxel basis.8 Previous studies have demonstrated that both MS and NMOSD showed fALFF alterations in sensorimotor, visual, and cognitive networks, but more decreased fALFF in visual networks was observed in patients with NMOSD.9⇓-11 These functional alterations have been reported to correspond to varying levels of physical disability and cognitive impairment.11⇓-13 However, the underlying physiologic substrates of these disease-related fALFF alterations remain unclear.
Imaging transcriptomics analysis provides a promising approach that allows brain-wide spatial analysis of microscopic transcriptome data combined with macroscopic neuroimaging phenotypes.14,15 Recently, established resources, such as the Allen Human Brain Atlas (AHBA; http://human.brain-map.org), can be used to spatially associate macroscale imaging data with the expression patterns of thousands of genes. Shen et al16 identified genes related to leukocyte activation and ribose phosphate anabolism in microglia as possible mechanisms underlying functional regional homogeneity abnormalities in patients with MS using the AHBA. However, the genetic mechanisms related to the functional alterations in NMOSD are unknown. An enhanced understanding of these genetic mechanisms in MS and NMOSD would provide insights into the potential drivers of fALFF alterations, elucidate clinical disabilities, and guide targeted therapy.
Therefore, in this study, we first explored the potential genetic mechanisms by spatially correlating brain-wide gene expression with functional alterations in MS and NMOSD. Furthermore, we investigated the associations between brain-wide gene expression and functional alterations across different clinical phenotypes to assess the clinical relevance of fALFF-associated genes.
MATERIALS AND METHODS
Participants
The discovery cohort was retrospectively enrolled from 7 centers, including 209 patients with relapsing-remitting MS, 90 with AQP4+ NMOSD, 49 with AQP4− NMOSD, and 228 healthy controls (HCs). The patients recruited fulfilled the inclusion criteria: 1) 2017 revised McDonald criteria for MS17 and 2015 International Panel for NMOSD Diagnosis;18 2) being in remission, defined as relapse-free for at least 4 weeks and steroid-free within 4 weeks before MRI scans;19 and 3) AQP4 antibody tested at least twice using a cell-based array with quantitative flow cytometry. Only patients who were seronegative with excluded myelin oligodendrocyte glycoprotein antibody in all tests were considered AQP4− NMOSD. The subjects were excluded on the basis of the following criteria: 1) incomplete clinical information; 2) poor image quality; and 3) a history of other neurologic or neuropsychological diseases. Clinical variables including sex, age, disease duration, Expanded Disability Status Scale (EDSS) scores, Paced Auditory Serial Addition Test scores, and the number of relapses were recorded. The Table lists the demographic and clinical characteristics of the patients and HCs.
The replication cohort prospectively collected in 2 centers included individuals with MS (n = 171), AQP4+ NMOSD (n = 149), and AQP4− NMOSD (n = 32). All participants provided informed consent. This study was approved by the local institutional review board.
MRI Preprocessing and Individual-Level fALFF Calculation
MRI scans were performed on a 3T MR scanner, including T2WI, FLAIR, high-resolution 3D T1WI, and rsfMRI. The MRI scan parameters for each center are summarized in the Online Supplemental Data. All rsfMRI data were processed using the Data Processing Assistant for Resting-State fMRI (DPABI, 4.3, Advanced edition software; http://rfmri.org/dpabi)20 based on Matlab 2019b (MathWorks). The fALFF in 142 cortical regions defined by the Destrieux cortical atlas (aparc.a2009s.annot in FreeSurfer; http://surfer.nmr.mgh.harvard.edu) was extracted in MS, AQP4+ NMOSD, and AQP4− NMOSD (Online Supplemental Data).
Brain Gene Expression Data Processing
The human microarray-based gene expression data from AHBA were processed with a toolbox (abagen toolbox, Version 0.1.3; https://github.com/rmarkello/abagen).21 We used a recently published pipeline to estimate regional gene expression levels across the cortex samples22 (Online Supplemental Data). After preprocessing and excluding tissue samples from the cerebellum and right hemisphere, we finally obtained the normalized regional expression data for 15,633 genes across 68 regions of the left hemisphere, compiled to form a 68 × 15,633 regional transcription matrix.
Donor-Level Partial Least Squares Regression Analyses
Partial least squares (PLS) was used to explore genes significantly associated with regional fALFF alterations. The first component of the PLS (PLS1) was the linear combination of gene expression values, which were most strongly correlated with regional fALFF alterations. The statistical significance of the variance explained by PLS1 was tested by permuting the response variables 10,000 times. Bootstrapping was used to estimate the variability of the positive or negative weight of each gene on PLS1 (|Z| scores of >5 and false discovery rate [FDR] adjusted P of .001, either negative, PLS1−, or positive, PLS1+) and rank its contribution to PLS1. Validation analysis is provided in the Online Supplemental Data.
Enrichment Analysis of Brain fALFF Alteration–Associated Genes
The shared and specific PLS1+ and PLS1− gene lists were input into the Metascape Web site (https://www.metascape.org), and Gene Ontology (GO), Kyoto Encyclopedia of Genes and Genomes (KEGG), and Hallmark Gene Sets enrichment analyses were performed to obtain the biologic pathways (P < .05, corrected by FDR). Expression-weighted cell-type (including microglia, endothelial cells, oligodendrocytes, astrocytes, excitatory and inhibitory neurons, and oligodendrocyte precursors) enrichment analysis was performed to determine whether the fALFF-related genes had higher expression within a particular cell type than expected by chance.23 The P value of the number of overlapping genes in each cell type was obtained by a hypergeometric distribution model and corrected by FDR with P < .05.
Links of PLS1 Genes and Clinical Indicators
We investigated whether brain fALFF alteration–related genes have an effect on disease clinical variables. The patients with MS, AQP4+ NMOSD, and AQP4− NMOSD were divided into 2 subgroups (subgroups 1 and 2) based on clinical variable values, such as EDSS–associated (EDSS ≤3 versus >3),24,25 disease duration–associated (disease duration ≤3 years versus >3 years), or relapse number–associated (relapse number = 1 versus >1). An fALFF t map (subgroup 1 versus subgroup 2) was obtained, and the correlation between the fALFF -t value and the normalized Z score of the identified PLS1− and PLS1+ genes was analyzed.
RESULTS
Group Differences in Brain Regional fALFF
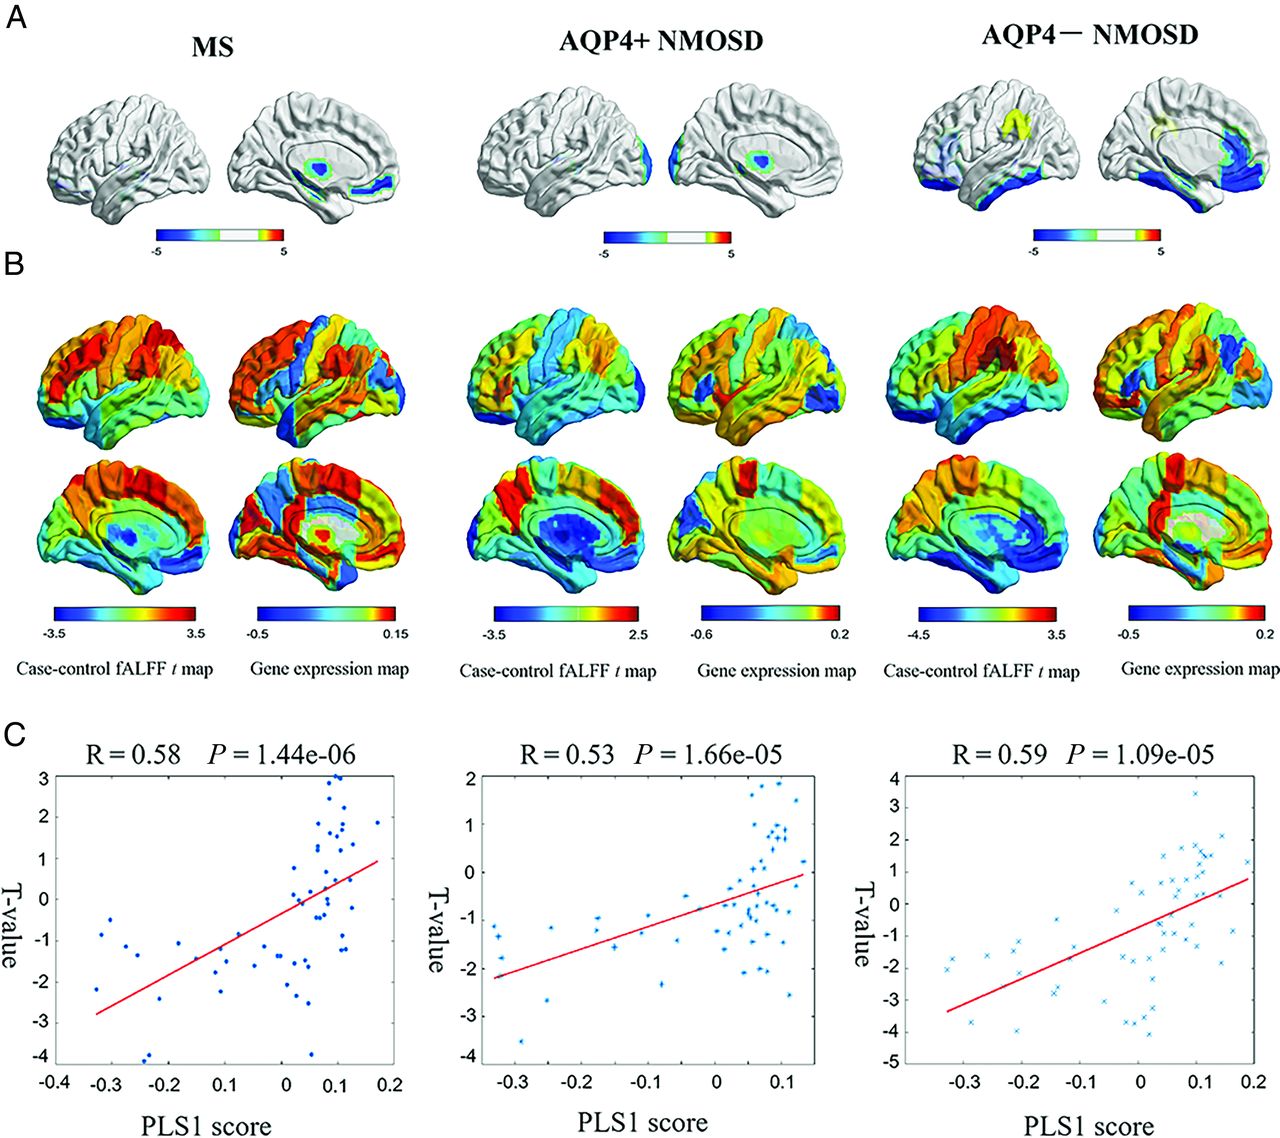
MS showed decreased fALFF in the left medial frontal cortex (t = −3.75, P = .0015), hippocampus (t = −3.77, P = .01), and thalamus proper (t = −3.92, P = .0087). Patients with AQP4+ NMOSD showed significantly decreased fALFF in the left thalamus proper (t = −3.51, P = .046) and occipital pole (t = −3.55, P = .012). AQP4− NMOSD showed specifically decreased fALFF in extensive associative regions, including the left medial frontal cortex (t = −4.07, P = .0003), hippocampus (t = −3.96, P = .01), gyrus rectus (t = −3.54, P = .0095), medial orbital gyrus (t = −3.74, P = .0003), inferior temporal gyrus (t = −3.24, P = .045), and anterior cingulate gyrus (t = −3.03, P = .01). Decreased fALFF was also involved in visual regions, such as the left fusiform gyrus (t = −3.69, P = .007) and deep gray matter, such as the left pallidum (t = −3.69, P = .0037) in patients with AQP4− NMOSD (Fig 1A and Online Supplemental Data). The correlation between fALFF alteration and clinical variables, including Paramedic Acute Stroke Treatment Assessment (PASTA, https://www.hra.nhs.uk/planning-and-improving-research/application-summaries/research-summaries/paramedic-acute-stroke-treatment-assessment-pasta/) and EDSS score is presented in the Online Supplemental Data.

Gene-expression profiles related to fALFF alterations. A, Cortical regions show statistically significant fALFF alterations in the MS, AQP4+NMOSD, and AQP4− NMOSD groups compared with the HC group (pFDR < .05). B, Regional case–control fALFF t map and corresponding weighted gene-expression map of regional PLS1 scores in the left hemisphere of MS (left), AQP4+NMOSD (middle), and AQP4− NMOSD (right). C, Scatterplots of regional PLS1 scores and regional changes in fALFF in MS (left), AQP4+NMOSD (middle), and AQP4− NMOSD (right).
Genes Related to fALFF Alteration
The PLS1 component explained a large variance in gene expression across case-control regional fALFF alterations (33.7% for MS, P[permutation] = 5000 = .0014; 28.0% for AQP4+ NMOSD, P(permutation) = 5000) = .0076; 34.3% for AQP4− NMOSD, P(permutation) = 5000 = .0002 using a spatial permutation test) (Fig 1B).
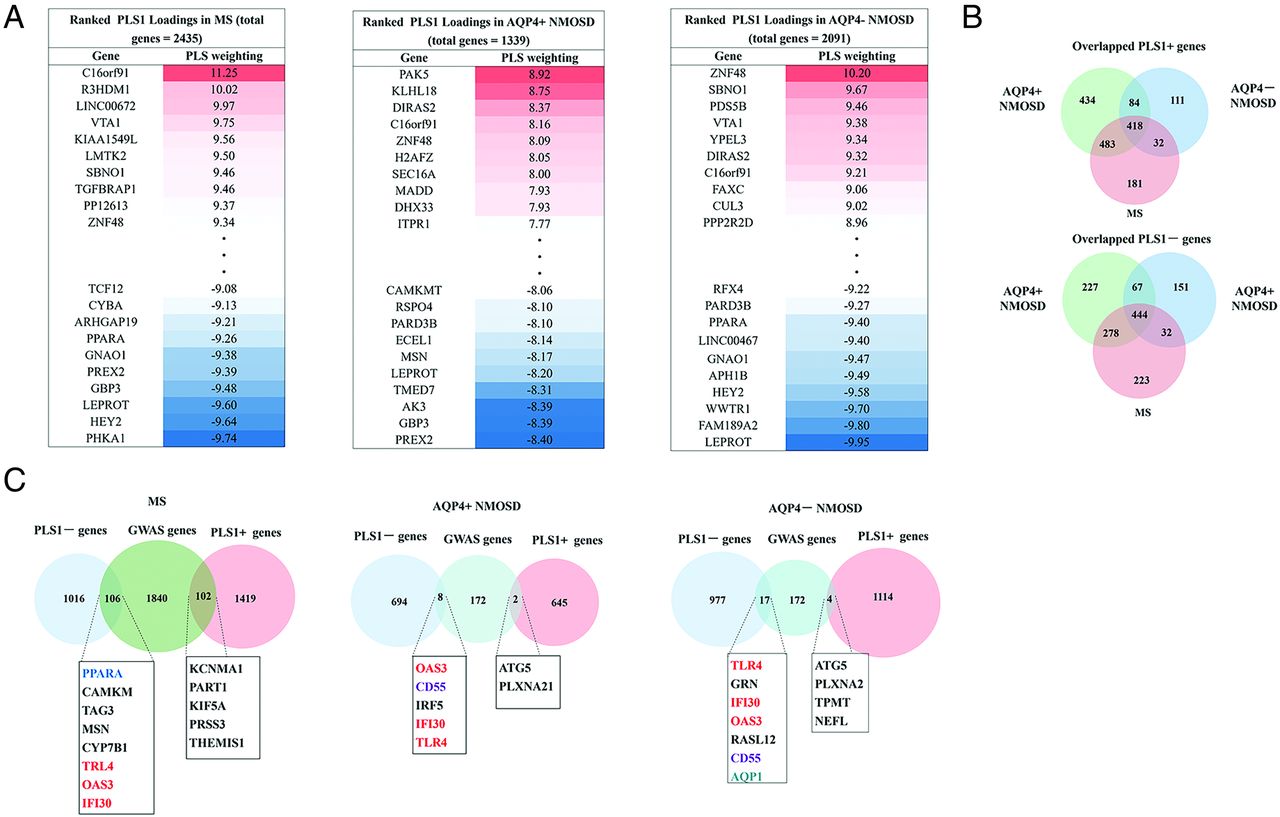
The PLS1 loading was spatially correlated with the fALFF alteration of MS (Pearson r = 0.58, P[permutation] =100,000) < .0001), AQP4+ NMOSD (Pearson r = 0.53, P[permutation] = 100,000] <.0001), and AQP4− NMOSD (Pearson r = 0.59, P[permutation] = 100,000) <.0001) (Fig 1C). fALFF-PLS1− and fALFF-PLS1+ genes were further defined according to the normalized PLS1 weightings (Z < −5 and Z > 5, pFDR [bootstrap = 100,000] <.0001). Finally, 1016 fALFF-PLS1− genes and 1419 fALFF-PLS1+ for MS; 694 fALFF-PLS1− genes and 645 fALFF-PLS1+ for AQP4+ NMOSD; 977 fALFF-PLS1− genes and 1114 fALFF-PLS1+ for AQP4− NMOSD were overexpressed (or underexpressed) as regional changes in fALFF increased (or decreased), respectively. The leading PLS1− and PLS1+ genes associated with fALFF are provided in Fig 2A. Validation results are present in the Online Supplemental Data.

Ranked PLS1 loading and overlapping genes. A, Identified leading fALFF-PLS1 gene (both PLS1+ genes, Z ≤ 5 and PLS−genes, Z > 5) listed using PLS regression for MS, AQP4+NMOSD, and AQP4− NMOSD. B, The number of overlapping PLS1+ and PLS1− genes among MS, AQP4+NMOSD, and AQP4− NMOSD genes. C, Overlapping genes of identified fALFF-PLS1 genes of MS, AQP4+NMOSD, and AQP4− NMOSD with the disease genome-wide association studies gene database. GWAS indicates genome-wide association study.
There were 444 overlapping fALFF-PLS1− genes and 418 overlapping fALFF-PLS1+ genes across MS, AQP4+ NMOSD, and AQP4− NMOSD. The specific fALFF-PLS1+ and fALFF-PLS1− genes of MS, AQP4+ NMOSD, and AQP4− NMOSD are further provided in Fig 2B.
Enrichment Pathway Associated with fALFF Alteration
MS, AQP4+ NMOSD, and AQP4− NMOSD showed extensive decreased fALFF; we further emphasized the shared or specific biologic process of the identified fALFF-PLS1− genes (in the discussion section, we will also focus on the underlying mechanism of fALFF-PLS1− genes).
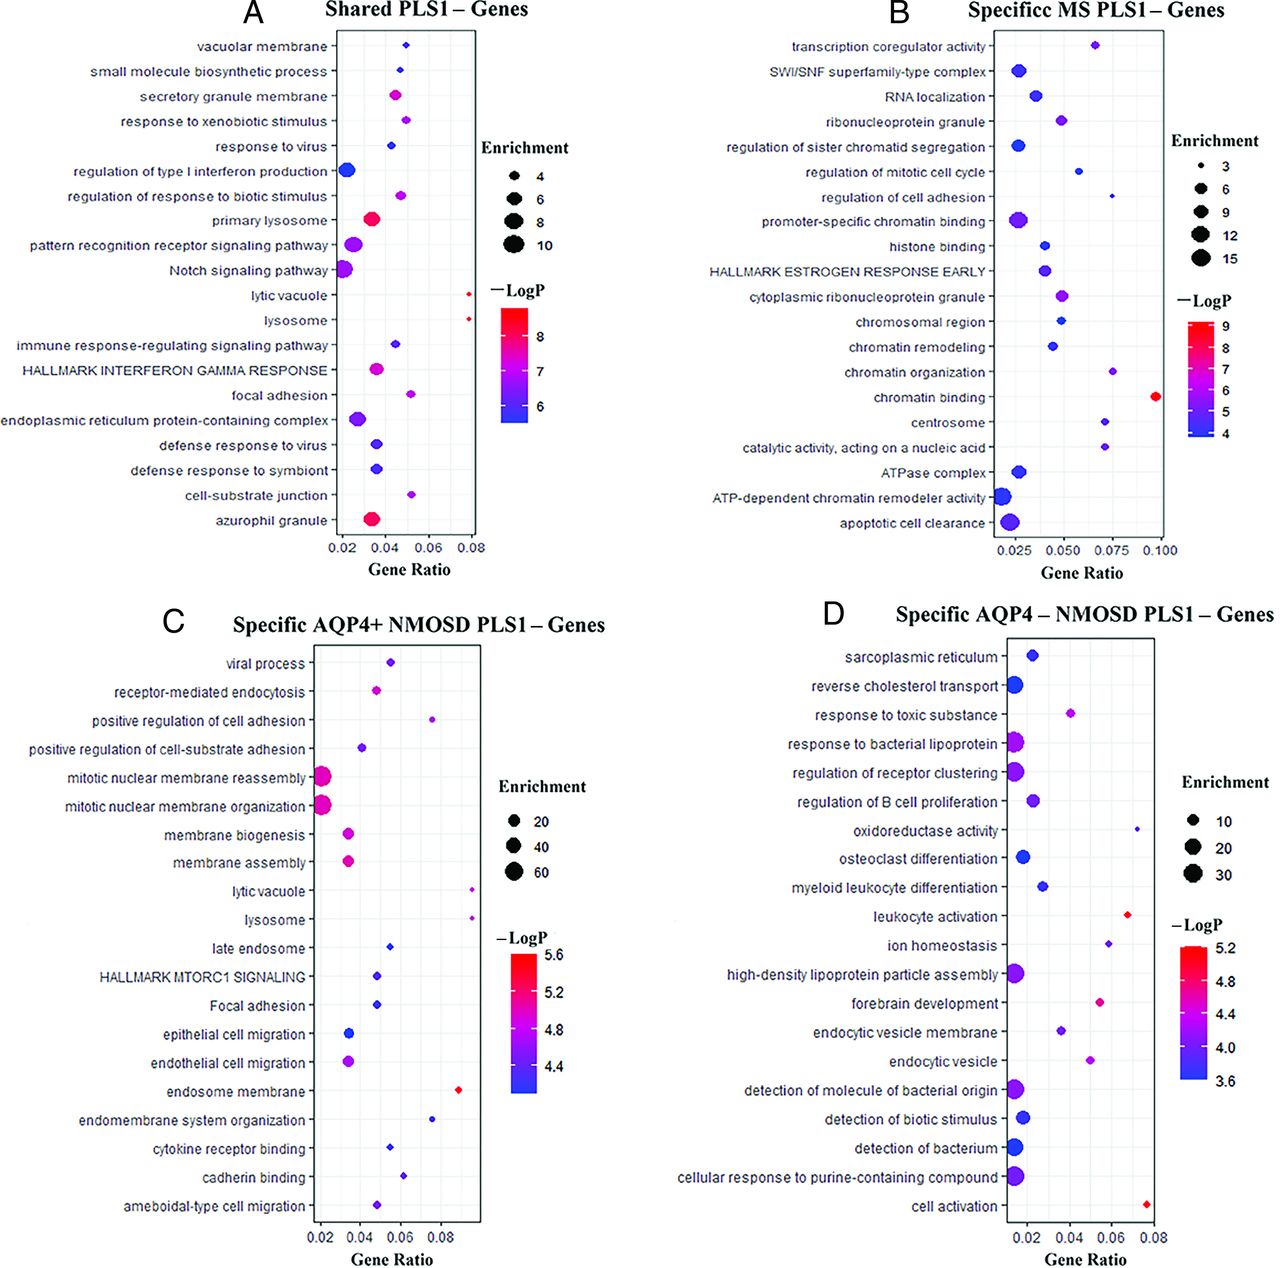
The shared fALFF-PLS1− genes across MS, AQP4+ NMOSD, and AQP4− NMOSD were enriched for GO terms, including “regulation of response to biotic stimulus,” “pattern recognition receptor signaling pathway,” and “regulation of type I infection production,” and KEGG pathway of “Notch signaling pathway” and Hallmark genes set of “HALLMARK INTERFERON GAMMA RESPONSE” (Fig 3A).

GO/KEGG/hallmark gene set enrichment analysis of fALFF-PLS1− genes. A, GO/KEGG/hallmark gene set enrichment analysis of shared fALFF-PLS1− genes across MS, AQP4+NMOSD, and AQP4-NMOSD. B, GO/KEGG/hallmark gene set enrichment analysis of specific fALFF-PLS1− genes of MS. C, Same as B, but specific fALFF-PLS1− genes for AQP4+NMOSD. D, Same as B, but specific fALFF-PLS1− genes for AQP4− NMOSD. −logP Indicates the logarithm of the P value.
The specific MS-PLS1− genes enriched for GO terms included “chromatin binding,” “ATP-dependent chromatin remodeller activity,” and “promoter-specific chromatin binding” (Fig 3B). The specific AQP4+ NMOSD-PLS1− genes enriched for GO terms included “mitotic nuclear membrane reassembly,” “positive regulation of cell adhesion,” and “endothelial cell migration” (Fig 3C). The specific AQP4− NMOSD-PLS1− genes were enriched for GO terms, including “cell activation,” “leukocyte activation,” and “regulation of B-cell proliferation” (Fig 3D). The enrichment analysis of shared and specific fALFF-PLS1+ genes across MS, AQP4+ NMOSD, and AQP4-NMOSD is provided in the Online Supplemental Data.
Canonical Cell Type Associated with fALFF Alteration
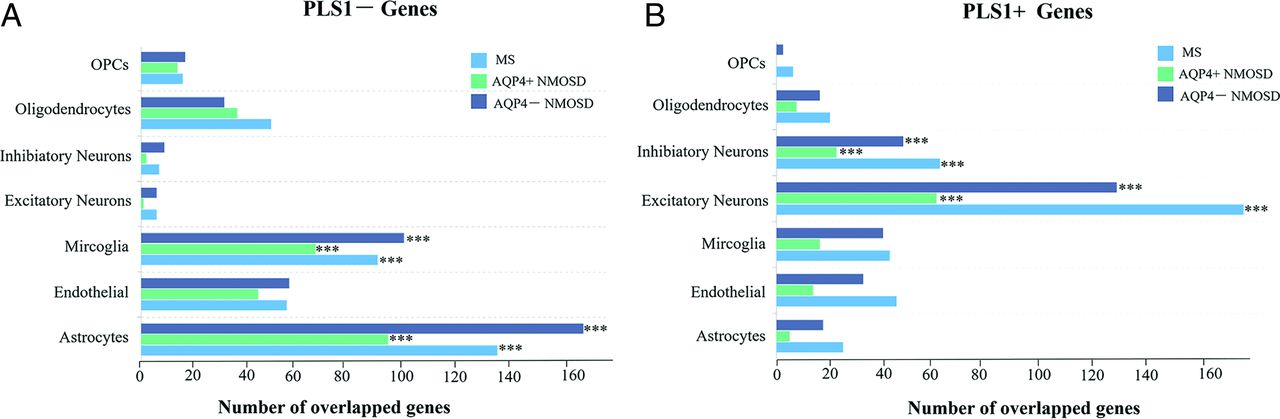
Most of fALFF-PLS1− genes across MS, AQP4+ NMOSD, and AQP4− NMOSD were enriched in astrocytes and microglia (all pFDR < .05 using the hypergeometric test, Fig 4A), while fALFF-PLS1+ genes were enriched in both excitatory and inhibitory neurons (all pFDR < .05 using the hypergeometric test, Fig 4B and Online Supplemental Data). Furthermore, enrichment analyses of identified fALFF-associated genes for each canonical cell type revealed similar biologic pathways across disorders. Specifically, fALFF-PLS1− genes enriched in microglia are relevant to the immune response, while the genes enriched in astrocytes are relevant to metabolic regulation. fALFF-PLS1+ genes enriched in neurons are relevant to the process of synaptic transmission (Online Supplemental Data).

Cell type−specific expression of fALFF alteration−associated genes. A, Overlapping genes between the PLS1− gene list and each cell type−specific gene in MS, AQP4+NMOSD, and AQP4−NMOSD. B, Same as A, but for the PLS1+ gene list in MS, AQP4+NMOSD, and AQP4−NMOSD. OPCs indicate oligodendrocyte precursors.
Links of fALFF-Associated PLS1 Weighted Genes and Clinical Variables
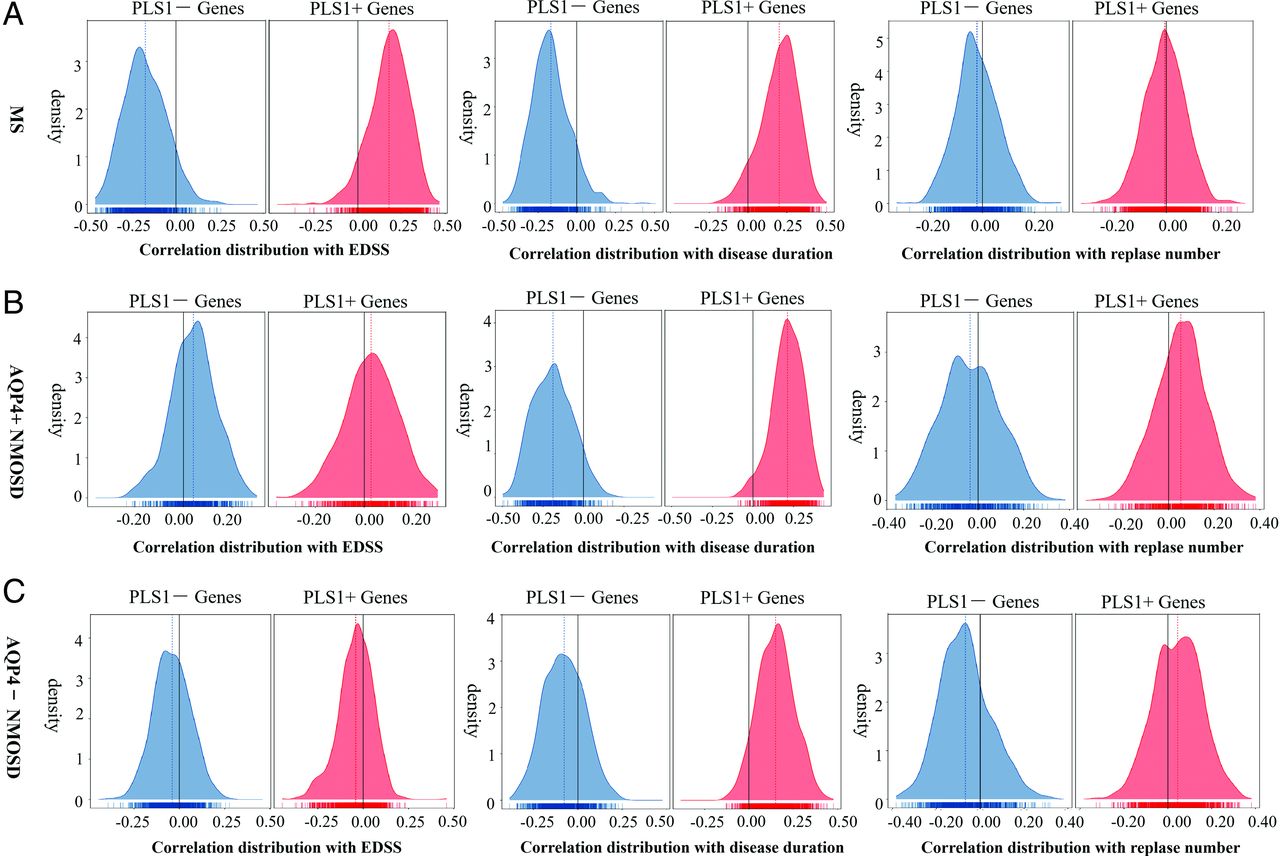
In MS, PLS1− and PLS1+ genes were negatively and positively correlated with the EDSS (mean value = −0.18 for PLS1− genes, 0.18 for PLS+ genes) and disease duration (mean value = −0.17, 0.20) and had no obvious correlation with the number of relapses (mean value = −0.020, −0.0053). In AQP4+ NMOSD, PLS1− and PLS1+ genes were positively and negatively correlated with disease duration (mean value = −0.19, 0.21) and had no obvious correlation with EDSS (mean value = 0.041, 0.028) and the number of relapses (mean value = −0.035, 0.053). In AQP4− NMOSD, PLS− and PLS+ genes positively and negatively correlated with disease duration (mean value = −0.077, 0.15) and had no obvious correlation with the EDSS (mean value = −0.040, −0.041) and number of relapses (mean value= −0.067, 0.045) (Fig 5).

The correlation between fALFF alteration−related genes and clinical variables. The correlation distributions between PLS1− (blue) and PLS1+ genes (red) and clinical indicators, such as EDSS (≤3 versus >3), disease duration (−3 years versus >3 years), and number of relapses (= 1 versus >1) in MS (A), AQP4+NMOSD (B), and AQP4−NMOSD (C).
DISCUSSION
MS, AQP4+ NMOSD, and AQP4− NMOSD showed decreased fALFF in the associative cortex and deep gray matter, while NMOSD (both AQP4+ and AQP4−) additionally demonstrated lower fALFF in the visual region. Gene transcriptional signatures associated with fALFF alterations were explored by combining AHBA. We observed that MS, AQP4+ NMOSD, and AQP4− NMOSD fALFF-related PLS− genes: 1) shared a biologic process response to regulation of immune response but were specifically enriched in epigenetics profile in MS, membrane disruption and cell adhesion in AQP4+ NMOSD, and leukocyte activation in AQP4− NMOSD; 2) were associated with a glial immune response and astrocytic metabolic regulation; and 3) were directly associated with EDSS of MS and disease duration across disorders. These results illuminated the microscopic genetic molecular mechanisms underlying the macroscopic fALFF alterations in MS and NMOSD, enhancing our understanding of the pathologic similarities and differences among these neuroinflammatory diseases. Furthermore, the fALFF-associated genes might serve as potential regulatory targets for improving clinical manifestations.
Regional fALFF Alterations in MS, AQP4+NMOSD, and AQP4- NMOSD
Decreased fALFF in patients with MS involved the left hippocampus and thalamus proper, as consistently reported in previous studies.6,26 MS and AQP4+ NMOSD both showed significantly decreased fALFF in the thalamus proper, suggesting that the thalamus may be collectively highlighted in the pathogenesis of both MS and AQP4+ NMOSD. Notably, fALFF shows a positive correlation with PASTA in patients with MS, but a negative correlation with PASTA in patients with AQP4+ NMOSD. This finding suggests that decreased fALFF in the thalamus may impair cognitive ability in MS, while there may be a harmful compensatory activation in the thalamus for the cognitive ability of patients with AQP4+ NMOSD. The differential involvement of the thalamus between MS and AQP4+ NMOSD has been reported in a multimodal study of the thalamus.6 One intriguing aspect of our results is that the thalamus was little affected in AQP4− NMOSD. A disease-specific pattern in the thalamus may indicate a disassociation between AQP4− NMOSD and AQP4+ NMOSD. We speculate that the different injury mechanisms for the 2 subtypes of NMOSD may be attributed to the expression of different isoforms of AQP. AQP4 has been found diffusely in the dorsal thalamus, and AQP4- immunoglobulin G may significantly accelerate neurotoxicity by destroying the BBB of the thalamic region.27 Additionally, decreased fALFF of the visual region was observed in participants with AQP4+ NMOSD and AQP4− NMOSD, supporting the more severe visual impairment in patients with NMOSD than in those with MS.11
The Shared Biologic Process across MS, AQP4 + NMOSD, and AQP4− NMOSD
MS, AQP4+ NMOSD, and AQP4− NMOSD shared biologic processes that respond to immune regulation. Interferon gamma is proinflammatory and produced by T-helper 1 cells, particularly the most potent stimuli for initiating inflammatory mediators.28 Interferon gamma–secreting cells appear in the CNS shortly before the onset of clinical signs in the experimental autoimmune encephalomyelitis (EAE) model.29 The Notch signaling pathway has been shown to regulate the development and function of both T-helper cells and oligodendrocytes in MS.30,31 We inferred that the involved immune response and the proinflammatory might cause neurologic dysfunction, as reflected by regionally decreased fALFF in patients with MS and NMOSD. Minter et al32 inhibited Notch signaling in an experimental EAE model, resulting in a notable decrease in clinical disease and a reduction in T-helper 1–associated cytokines.32 Our results are complementary to previous studies.32 The shared Notch signaling pathway may suggest potential therapeutic implications not only in MS but also in both AQP4+ and AQP4− NMOSD.
The Specific Biologic Processes of MS, AQP4+ NMOSD, and AQP4− NMOSD
The different PLS− genes underlying fALFF alterations provided insight into the high heterogeneity across MS, AQP4+ NMOSD, and AQP4− NMOSD. The identified specific MS-PLS1− genes were significantly enriched for the epigenetics (chromatin modification) profile. Studies have implied that epigenetic modifiers coordinate with transcriptional regulators or signaling pathways, which expand the regulatory network of myelination.33 The thalamus is typically more densely myelinated and serves as a key brain hub with extensive afferent and efferent connections in subcortical and cortical areas.34 Under physiologic conditions, myelin functions in axonal ensheathment and supports axonal integrity.35 Studies have shown that apoptotic neurons and transected neurites are significantly increased in demyelinated compared with myelinated cortex.36 The observed decreased fALFF in the thalamus in MS may due to local inflammatory demyelination and changes secondary to axonal transection.
The unique AQP4+ NMOSD-PLS1− genes were significantly enriched in membrane disruption and cell adhesion. AQP4+ NMOSD exhibits serious BBB disruption because AQP4-immunoglobulin G plays a direct role in damaging astrocytes.27 The destruction of the BBB may trigger neurotoxicity, suggesting that the reduction in fALFF within the thalamus is primarily due to pathogenic factors in the CSF affecting neurons as a result of BBB damage in AQP4+ NMOSD. Generally, the neuropathological features of decreased fALFF in the thalamus in NMOSD differ from those in MS. Pathological studies have shown that certain features, such as lymphocyte infiltration, complement deposition, and BBB disruption, are usually absent in chronic postmortem MS samples.37 These findings provide reasonable evidence supporting our results.
The unique AQP4− NMOSD-PLS1− genes, which code for leukocyte activation and regulation of B-cell proliferation, indicate that AQP4− NMOSD is primarily a B-cell-driven disease.38 We inferred that the inflammatory brain state caused by widespread immune activation could lead to decreased neural activity in extensive associative and visual regions. Additionally, although specific autoantibodies have still not been confirmed in AQP4− NMOSD, the specific fALFF-PLS− gene AQP1 may provide a clue.
Cellular Characterization of MS-, AQP4+ NMOSD-, and AQP4− NMOSD–Related Genes
Astrocytes and microglia were the most significant proportion in fALFF-PLS− cell-type genes in MS and NMOSD (both AQP4+ NMOSD and AQP4− NMOSD), suggesting that they have central roles in the disease process. The activated microglial immune response plays a crucial role in the disease process of MS and NMOSD by initiating inflammation and aggravating neuronal damage.39 Additionally, synaptic stripping has been classically linked to microglial function, and the overactivation of microglia might result in severe synapse loss, as we observed in MS and NMOSD.35 It is well-known that brain function primarily depends on synaptic function.
Astrocytic metabolic regulation disorder suggests the increased susceptibility of astrocytes to damage. Neural activity depends on the structure and function of the neuro-glio-vascular unit, and astrocytes can signal to endothelial cells to increase local blood flow to adapt to energy demand.40 The regulatory mechanism of CBF is the crucial neural basis for available detected fALFF signals. The demyelinated core of MS lesions consists of reactive astrogliosis, which builds sclerotic tissue thought to damage the neuro-glio-vascular unit and inhibit neural activity.41 In NMOSD, astrocyte lysis and fibrous gliosis also interfere with the function of the neuro-glio-vascular unit.42 These findings link fALFF-related putative genetic molecular perturbations with cell vulnerability and highlight the important role of microglia and astrocytes.
The Correlation between fALFF Alteration–Related Genes and Clinical Variables
In the current study, we observed that fALFF alteration–associated PLS1− genes were negatively correlated with EDSS-associated fALFF alterations in MS, indicating that the underlying genes responsible for decreased fALFF in MS may further clinically translate into more severe physical disability. However, this correlation was not observed in AQP4+ NMOSD and AQP4− NMOSD. These findings indicate that targeting the genes underlying decreased fALFF in MS might improve physical ability in patients, though such modulation may be less effective in NMOSD.
Regional fALFF alteration–associated PLS1− genes have a significantly negative correlation with disease duration but not relapse number–associated fALFF alterations across MS, AQP4+ NMOSD, and AQP4− NMOSD. Although NMOSD has a rapid onset and MS is a chronic demyelinating disease,43 irreversible damage to neural activity occurs with prolonged disease duration. This outcome suggests that therapeutic strategies targeting these underlying genetic factors may be effective in the early stages of the diseases.
Limitations
The current study should be interpreted in light of several limitations. First, because fALFF is an indirect reflection of neural activity, the significant contribution from vascular signals should be considered carefully. Second, only one-half of the fALFF-associated genes had good repeatability in the retrospective and prospective cohorts. We inferred that balancing the sample size of different multicenters is warranted to validate our findings. Third, we observed that correlation between genes and fALFF alterations does not directly reveal causal mechanisms, because the AHBA gene data were derived from postmortem measurements of a small sample.44 Further biologic validations of the identified genes are needed to confirm our current results. Finally, the regional gene expression may be influenced by MS and the use of disease-modifying treatments. However, due to the evaluation of an atlas-based distribution of gene expression obtained from HC, these influences cannot be explored exactly.
CONCLUSIONS
Collectively, we clarified the genetic molecular mechanisms underlying the macroscopic fALFF alterations in MS and NMOSD. The underlying shared and specific gene transcriptional signatures driving the brain functional alterations in MS, AQP4+, and AQP4– NMOSD enhanced our understanding of the pathologic similarity and differences of these neuroinflammatory diseases. Genes associated with fALFF alterations were further clinically relevant and may serve as potential regulatory targets for improving clinical manifestations.
| HC (n = 228) | MS (n = 209) | AQP4+ NMOSD (n = 90) | AQP4- NMOSD (n = 49) | |
|---|---|---|---|---|
| Age (year), No. Median [IQR] | 228 37 [27–48] | 209 36 [28–45] | 90 46 [35–57] a,b | 49 41 [30–53] |
| Sex, No. Female/male | 228 124/104 | 209 135/74a | 90 83/7b | 49 37/12 |
| Education (year), No. Median [IQR] | 162 16 [15–19] | 158 14 [11–15] | 44 12 [9–14] | 34 14 [11–15] |
| Disease duration (month), No. Median [IQR] | NA | 218 19 [5–19] | 86 48 [15–84]b | 48 12 [8–60] |
| EDSS, No. Median [IQR] | NA | 194 2.0 [1.0–3.0] | 84 3.5 [2.5–6.0]b | 40 3.5 [2.5–6.0] |
| PASAT, No. Median [IQR] | 152 51.5 [43–57] | 65 42 [35–48]a | 44 39 [32–46]a | 30 42 [36.5–53.5]a |
| No. of relapses, No. Median [IQR] | NA | 66 3 [2–4] | 59 3 [2–5] | 35 2 [1–4] |
Note:—PASAT indicates Paced Auditory Serial Addition Test; NA, not applicable.
a A statistical significance compared with HC.
b Statistical significance compared with MS.
c Statistical significance compared with AQP4+ NMOSD.
d Statistical significance compared with AQP4− NMOSD.
Demographic and clinical characteristics
Footnotes
Yuna Li and J. Sun contributed equally to the article.
Yuna Li and Jun Sun are first authors and contributed equally to this work.
Yongmei Li, Huxing Zhang and Yaou Liu are senior authors and contributed equally to this work.
This work was supported by the Ministry of Science and Technology of China-National Key Research Project (NO.2022YFC2009904), National Science Foundation of China (NO.82330057), Beijing Hospital Management Center-Climb Plan (No. DFL20220503), Capital Medical University Young Scholars (Y.L.), Capital Medical Science Innovation Center Scientific Research Pioneering Project (NO.CX23YQ06), National Science Foundation of China (NO. 822020840), Young Scientists Program of Beijing Tiantan Hospital, Capital Medical University (NO.YSP202205), and Youth Project of Beijing Natural Science Foundation (NO.7244328).
Disclosure forms provided by the authors are available with the full text and PDF of this article at www.ajnr.org.
References
- 1.
- 2.
- 3.
- 4.
- 5.
- 6.
- 7.
- 8.
- 9.
- 10.
- 11.
- 12.
- 13.
- 14.
- 15.
- 16.
- 17.
- 18.
- 19.
- 20.
- 21.
- 22.
- 23.
- 24.
- 25.
- 26.
- 27.
- 28.
- 29.
- 30.
- 31.
- 32.
- 33.
- 34.
- 35.
- 36.
- 37.
- 38.
- 39.
- 40.
- 41.
- 42.
- 43.
- 44.
- Received February 14, 2024.
- Accepted after revision July 17, 2024.
- © 2024 by American Journal of Neuroradiology