Abstract
BACKGROUND AND PURPOSE: While three-dimensional susceptibility-weighted imaging has been widely suggested for intracranial vessel imaging, hemorrhage detection, and other neuro-diseases, its relatively long scan time has necessitated the clinical verification of recent progresses of fast imaging techniques. Our aim was to evaluate the effectiveness of brain SWI accelerated by compressed sensitivity encoding to identify the optimal acceleration factors for clinical practice.
MATERIALS AND METHODS: Ninety-nine subjects, prospectively enrolled from 5 centers, underwent 8 brain SWI sequences: 5 different folds of compressed sensitivity encoding acceleration (CS2, CS4, CS6, CS8, and CS10), 2 different folds of sensitivity encoding acceleration (SF2 and SF4), and 1 without acceleration. Images were assessed quantitatively on both the SNR of the red nucleus and its contrast ratio to the CSF and, subjectively, with scoring on overall image quality; visibility of the substantia nigra–red nucleus, basilar artery, and internal cerebral vein; and diagnostic confidence of the cerebral microbleeds and other intracranial diseases.
RESULTS: Compressed sensitivity encoding showed a promising ability to reduce the acquisition time (from 202 to 41 seconds) of SWI while increasing the acceleration factor from 2 to 10, though at the cost of decreasing the SNR, contrast ratio, and the scores of visual assessments. The visibility of the substantia nigra–red nucleus and internal cerebral vein became unacceptable in CS6 to CS10. The basilar artery was well-distinguished, and diseases including cerebral microbleeds, cavernous angiomas, intracranial gliomas, venous malformations, and subacute hemorrhage were well-diagnosed in all compressed sensitivity encoding sequences.
CONCLUSIONS: Compressed sensitivity encoding factor 4 is recommended in routine practice. Compressed sensitivity encoding factor 10 is potentially a fast surrogate for distinguishing the basilar artery and detecting susceptibility-related abnormalities (eg, cerebral microbleeds, cavernous angiomas, gliomas, and venous malformation) at the sacrifice of visualization of the substantia nigra–red nucleus and internal cerebral vein.
ABBREVIATIONS:
- BA
- basilar artery
- CMB
- cerebral microbleed
- CR
- contrast ratio
- CS
- compressed sensing
- GRAPPA
- generalized autocalibrating partially parallel acquisition
- ICV
- internal cerebral vein
- RN
- red nucleus
- RS
- reference protocol without SENSE or CS-SENSE acceleration
- SENSE
- sensitivity encoding
- SN
- substantia nigra
- SNRRN
- SNR of the RN
SWI acquires tissue signal with both magnitude and phase information using a 3D gradient recalled-echo sequence.1 SWI is advantageous for detecting microhemorrhages and microvasculature2⇓-4 and is useful in diagnosing small-vessel diseases,5,6 assessing stroke recovery in vascular neurosurgery,7 and for better anatomic localization in functional neurosurgery and gamma knife radiosurgery.2,8 Despite its wide applications in vessel imaging and hemorrhagic detection, SWI was limited by the long acquisition time, which may lead to patient discomfort, motion artifacts, and examination failure.9 To accelerate SWI, parallel imaging techniques such as sensitivity encoding (SENSE) and generalized autocalibrating partially parallel acquisition (GRAPPA) have been extensively used to reduce the number of phase-encoding steps through the use of multichannel receiver arrays.10,11 Acceleration factor 2 for SENSE or GRAPPA on SWI sequences (typical scan time of about 3 minutes when the whole brain is covered with submillimeter spatial resolution) was generally used in practice, but unfortunately, a higher acceleration factor was rarely used considering the image-quality degradation due to increased image noise and parallel imaging–related image artifacts.3,12 Chung et al13, and Conklin et al14 have both suggested wave-controlled aliasing in parallel imaging acceleration as a potential tool for accelerating SWI with an acceptable diagnosis of intracranial lesions, but there has been no report on the generalized application of wave-controlled aliasing in parallel imaging in a multicenter clinical setup. The compressed sensing (CS) technique was reported to be a promising acceleration method in brain MR imaging,15,16 while the effectiveness of CS-accelerated SWI in clinical practice has been understudied, especially in a multicenter design, and the optimal CS acceleration factors in clinical examinations remain unclear.
In this work, we aimed to evaluate the effectiveness of CS acceleration for SWI and identify the optimal CS acceleration factors for clinical practice in a multicenter cohort. We systematically evaluated the image quality and diagnostic efficacy on cerebral microbleeds (CMBs) and other cerebral diseases for CS-accelerated SWI with 5 different acceleration factors ranging from 2 to 10. These results were compared with those of the images acquired with conventional SENSE acceleration (factors 2 and 4) and a nonaccelerated sequence.
MATERIALS AND METHODS
Ethics
This study was approved by the Animal and Human Ethics Committee of each participant center. Informed consent was obtained from all the participants.
Study Population
Between April 2019 and March 2020, we prospectively enrolled participants from 5 centers—center 1: Beijing Tiantan Hospital, Capital Medical University, Beijing; center 2: Beijing Royal Integrative Medicine Hospital, Beijing; center 3: The Affiliated Drum Tower Hospital of Nanjing University Medical School, Nanjing; center 4: the First Affiliated Hospital of Dalian Medical University, Dalian; and center 5: Shengjing Hospital of China Medical University, Shenyang. The inclusion criteria were as follows: participants older than 18 years of age and patients suspected of/confirmed with cerebrovascular diseases or healthy volunteers. The exclusion criteria were an incomplete MR imaging examination, and images with severe motion artifacts.
MR Imaging Protocols
Each participant was scanned head-first in the supine position at 3T (Ingenia CX; Philips Healthcare) at 1 of the 5 centers where the same MR imaging systems were installed with a 32-channel head coil (which is commercially available as a default component to the Philips Healthcare MR imaging system) and equipped with Compressed SENSE (a combination of CS and SENSE, hereafter referred as CS-SENSE, commercially available from Philips Healthcare).17 The reconstruction algorithm of CS-SENSE essentially followed the technique described by Lustig and Pauly.18
A routine brain MR imaging including transverse T2-weighted turbo spin-echo, sagittal 3D T1 turbo field echo, sagittal 3D FLAIR, and transverse diffusion-weighted echo-planar imaging was performed for all patients with suspected or confirmed intracranial diseases. Eight customized 3D SWI protocols (susceptibility-weighted imaging with phase enhancement, SWIp;19 Philips Healthcare) were predesigned and optimized at Beijing Tiantan Hospital and then replicated in the MR imaging systems of other hospitals. These 8 protocols were additionally scanned in a random order. For healthy volunteers, routine brain MR imaging was optional, but the 8 susceptibility-weighted images were required. If any abnormal signal was found on SWI for the healthy volunteers, the routine MR imaging would also be performed. Among the 8 protocols, 5 used CS-SENSE with acceleration factors of 2, 4, 6, 8, and 10 (denoted as CS2, CS4, CS6, CS8, and CS10, respectively); 2 used the conventional SENSE technique with acceleration factors of 2 and 4 (denoted as SF2 and SF4, respectively); and 1 was a reference protocol without SENSE or CS-SENSE acceleration (denoted as RS). The parameters for the 8 SWI protocols are listed in the Online Supplemental Data. The image reconstruction was performed in real-time during the scan.
Image Evaluation
Images were transferred to the IntelliSpace Portal, Version 7.0 (Philips Healthcare) workstation and processed as below before evaluations. First, all images were checked visually to exclude subjects with images that had unacceptable motion artifacts. Second, image realignment was performed using Statistical Parametric Mapping (SPM 12; http://www.fil.ion.ucl.ac.uk/spm/software/spm12) for images acquired by the 8 sequences on the same subject. Third, the information about the subject and sequence was removed from all images.
Quantitative measurements were performed on Matlab R2016b (MathWorks). Because the visualization of red nucleus (RN) is important on SWI for evaluating neurodegenerative disorders,20⇓-22 we chose the RN for the calculation of the SNR and contrast ratio (CR). Signal intensities of RN and CSF were measured from the magnitude images based on ROIs with the help of a semiautomatic segmentation process (programed in Matlab) supervised by 2 neuroradiologists (L.G. and Y.D., with >10 years of neuroradiology experience). When we drew ROIs for RN or CSF in 1 participant, an equivalent size was chosen for the 8 protocols. The CSF measurements were mainly obtained on the lateral ventricles. The artificial reduction of noise within CS-SENSE images by iterative reconstruction makes the classic SNR and contrast-to-noise ratio measurements problematic, and to still be able to quantify potential signal differences among the sequences with different acceleration factors, the SNR of the RN (SNRRN) and the CR between the RN and the CSF (CRRN/CSF) were calculated as23,24

 where
where  and
and  were the ROI-based mean signal intensities of the RN and the CSF, and
  and
and  were the variances.
Visual assessment was performed by 2 neuroradiologists (L.G. and Y.D., with >10 years’ experience) independently, blinded to the patient information and imaging parameters. The overall image quality and the visibility of the substantia nigra (SN) and RN (SN-RN), the visibility of the internal cerebral vein (ICV), and the visibility of the basilar artery (BA) for all 8 protocols were assessed according to the scoring system listed in the Online Supplemental Data, both based on a previous study13 and on discussion with the neurologists and neurosurgeons from Beijing Tiantan Hospital for the clinical focuses. Protocols with mean scores of <2 were considered unacceptable for clinical setup due to severe blurring, nonuniform signal, obscure visualization, or severe artifacts. The diagnosis and counting of CMBs were based on the Microbleed Anatomical Rating Scale,25 in which the CMBs are classified as “definite” or “possible,” and we focused only on the definite CMBs. Before evaluation, the 2 neuroradiologists completed a training session with the images of 5 patients to help them reach a consensus on the diagnosis and image evaluations. When other intracranial lesions besides the CMBs were suspected on the SWI, the routine images or other available clinical data were used to confirm the diagnosis.
Statistical Analysis
Statistical analyses were performed using Matlab R2016b (MathWorks). The interobserver reliability on quantitative measurements and visual assessment between the 2 neuroradiologists were assessed through the Cohen κ test (excellent agreement if κ > 0.9; good agreement if κ > 0.6). When good agreement was achieved between the 2, the average values between the 2 were used for the subsequent analysis. The Kolmogorov-Smirnov test and Levene test were completed to determine whether the quantitative and qualitative data met the distribution with normality and homoscedasticity. If the data were in accordance with the assumed distribution, the repeated-measures ANOVA test (for SNR and CR) would be performed to verify the differences among the 8 sequences, and if not, the Friedman test (for the visual scores) would be used. Differences between each pair of protocols were evaluated by multiple comparisons with P values corrected by the Bonferroni correction. For all tests, P < .05 was considered statistically significant.
RESULTS
Participant Cohort
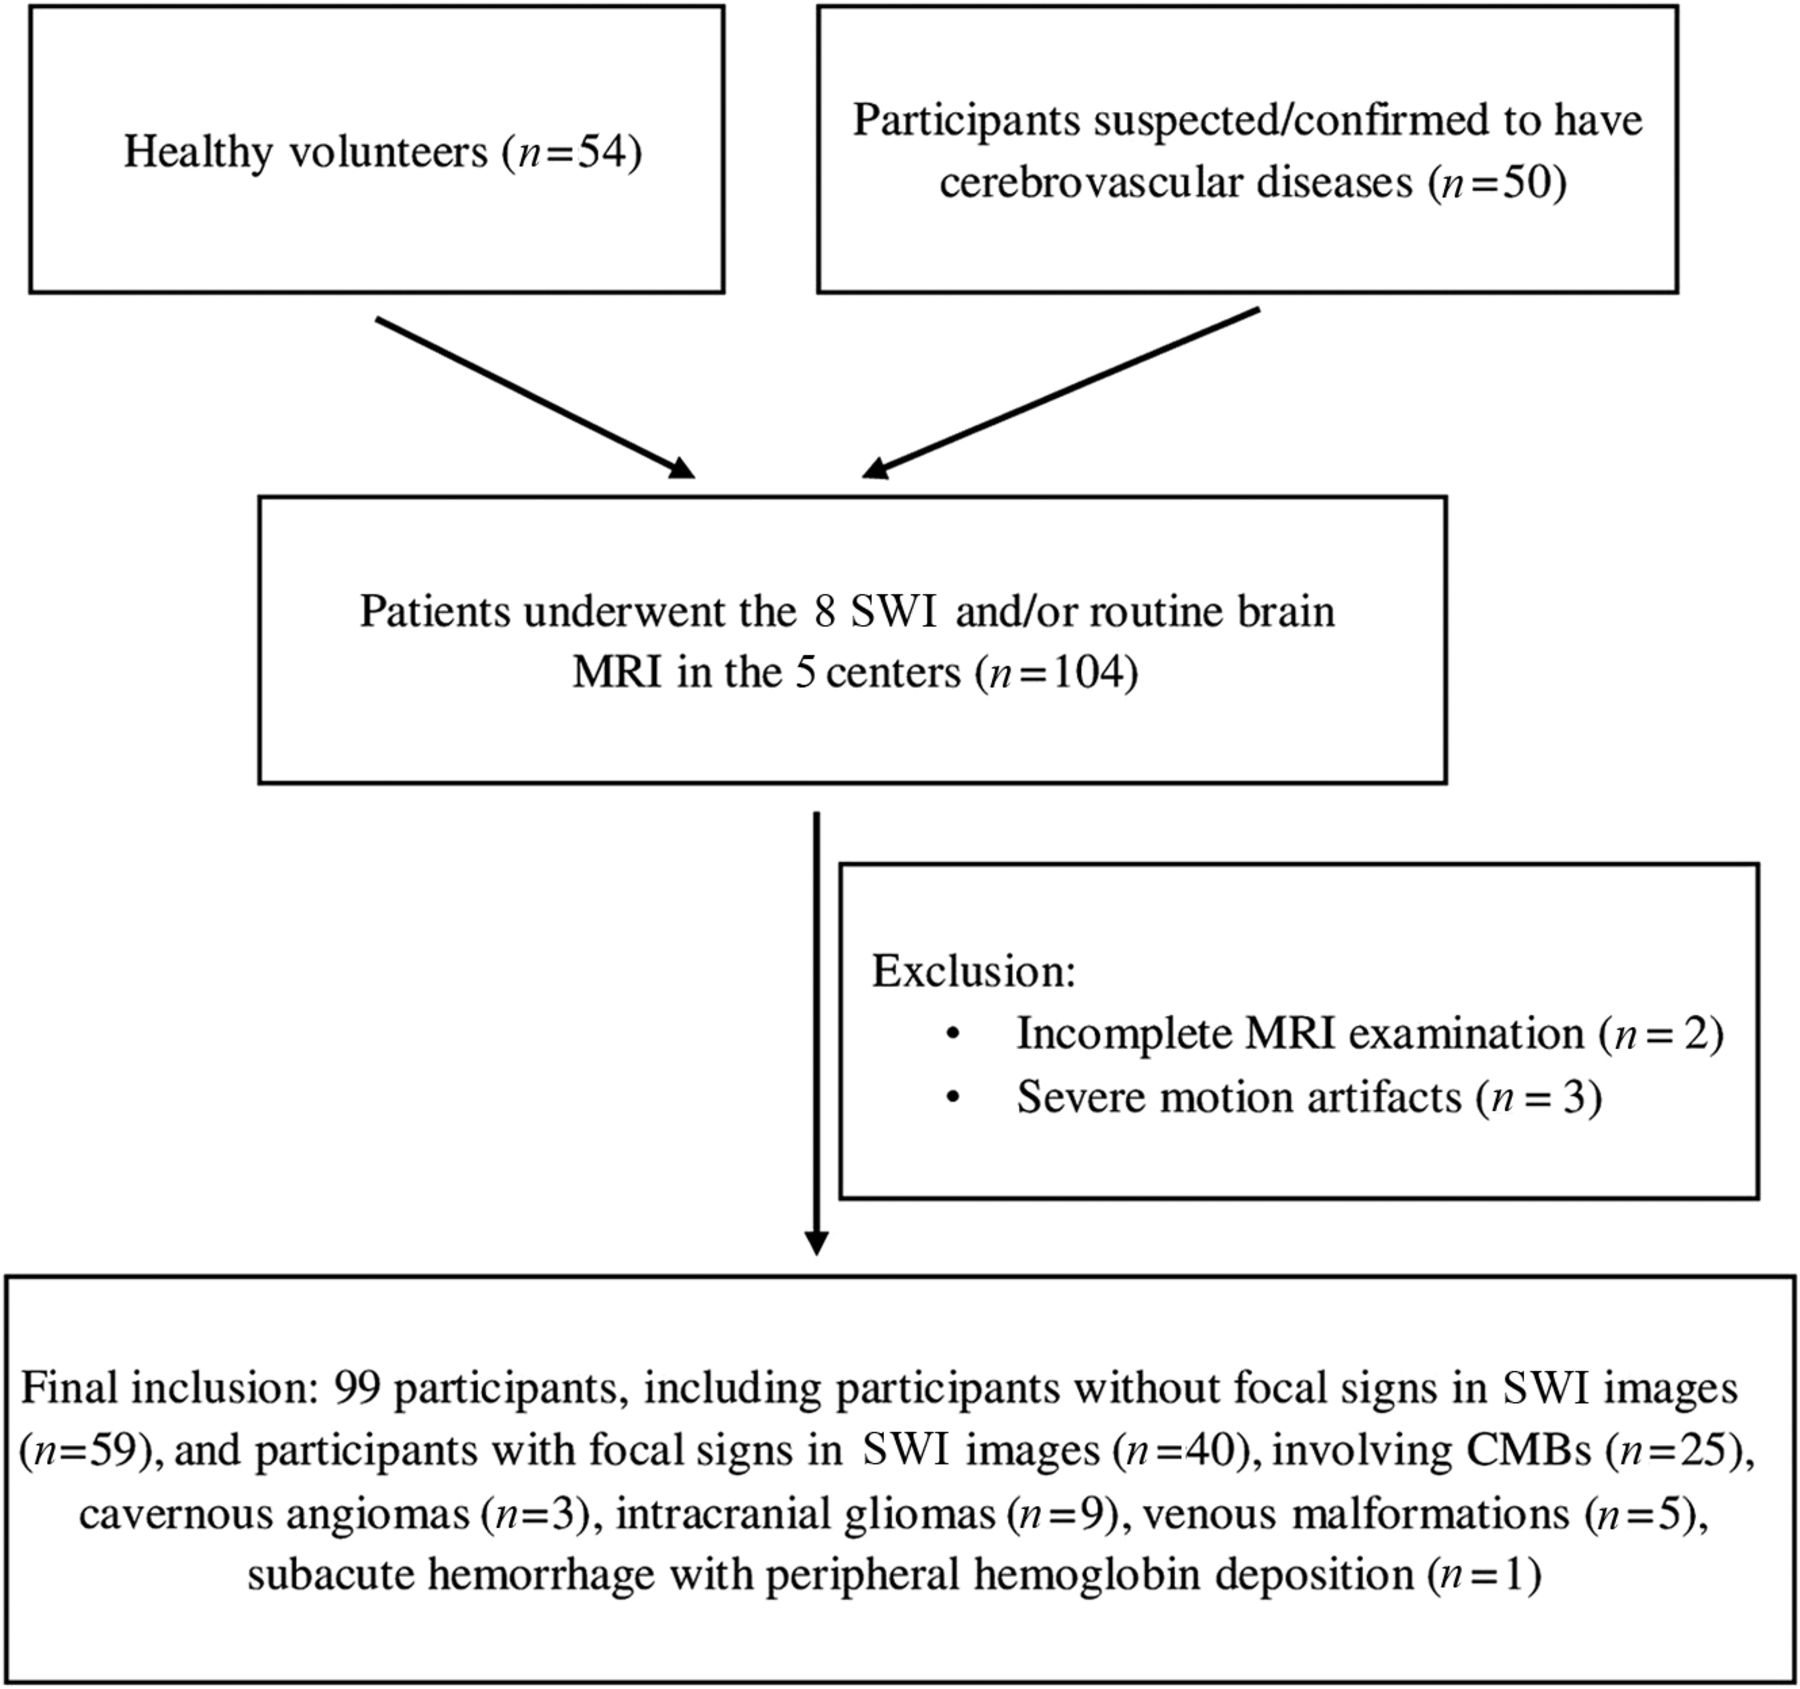
A total of 104 participants from the 5 centers completed the full set of scans (center 1: 27 cases; center 2: 20 cases; center 3: 24 cases; center 4: 19 cases; and center 5: 14 cases). After initial assessment of all collected images, 3 participants were excluded due to severe motion artifacts and 2 participants were excluded due to incomplete study protocols. Finally, 99 participants (45 men and 54 women; mean age, 45.7 [SD, 17.1] years; range, 18–88 years) were enrolled. Forty participants showed at least 1 focal lesion on SWI, with the remaining 59 participants showing no obvious focal lesions. When we comprehensively considered the SWI and other available images or clinical data, the detected abnormalities included CMBs (25 cases), cavernous angiomas (3 cases), intracranial gliomas (9 cases), venous malformations (5 cases), and subacute hemorrhage (1 case). Three participants showed 2 of the above-mentioned abnormalities at the same time. The enrollment flow chart is detailed in Fig 1.

Enrollment flow chart for the study population.
Quantitative Measurements
Good or excellent agreement was reached between the 2 neuroradiologists for the signal intensity measurements of the RN and CSF in images acquired by each of the 8 SWI sequences (κ ≥ 0.798).
SNRRN.
The mean SNRRN was the highest in CS2 and the lowest in SF4, among the 8 SWI sequences (Online Supplemental Data). As the CS-SENSE factor increased, the mean SNRRN decreased gradually, and the measured SNRRNs were significantly different among the 8 sequences (P < .05, repeated-measures ANOVA). Significant differences were found in pair-wise comparisons except for between RS and CS2, between SF2 or CS4, between SF2 and CS4, between CS6 and CS8, and between CS8 and CS10 (Online Supplemental Data).
CRRN/CSF.
The mean CRRN/CSF was the highest in CS2 and the lowest in SF4, among the 8 SWI sequences (Online Supplemental Data). As the CS-SENSE factor increased, the mean CRRN/CSF decreased gradually. A significant difference was found among the 8 sequences (P < .05, repeated-measures ANOVA). As for the pair-wise comparison, no difference was found between RS and CS2, SF2, or CS4, between SF2 and CS4, between CS6 and CS8, and between CS8 and CS10 (Online Supplemental Data).
Visual Assessment
Good or excellent agreement was reached between the 2 neuroradiologists for scoring overall image quality (κ ≥ 0.835), the visibility of the ICV (κ ≥ 0.811), the visibility of the SN-RN (κ ≥ 0.864), the visibility of the BA (κ ≥ 0.925), and the counting of CMBs (κ ≥ 0.937) in images acquired by each of the 8 SWI sequences. Representative images with different scores for the overall image quality, the visibility of SN-RN, and the visibility of BA are shown in the Online Supplemental Data.
Overall Image Quality.
The mean score for overall image quality was the highest in CS2 and the lowest in SF4 among the 8 SWI sequences (Online Supplemental Data). As the CS-SENSE factor increased, the mean score decreased gradually. A significant difference was found among the 8 sequences (P < .05, Friedman test). No significant difference was found in the pair-wise comparison between RS and CS2, CS4 or CS6, between SF2 and CS4 or CS6, and between CS4 and CS2 or CS6 (Online Supplemental Data). SF4 and CS10 were considered unacceptable for overall image quality because their mean scores were both <2. Generally, no obvious difference was observed for the susceptibility artifacts near the air-bone boundaries in the 8 susceptibility-weighted images (Fig 2A–H), no specific artifacts were observed for the CS sequences, but rougher textures and increased noise were observed in zoomed images when increasing the CS-SENSE or SENSE factor, especially for CS10 and SF4 (Fig 2I–P).

Visualization of 2 CMBs on the right side of the pons (A–H, indicated by the oblique arrows) and the ICV (I–P, indicated by the horizontal arrows) in the 8 susceptibility-weighted images.
Visibility of the SN-RN.
The mean score for the visibility of SN-RN was the highest in CS2 and the lowest in SF4, among the 8 SWI sequences (Online Supplemental Data). As the CS-SENSE factor increased, the mean score decreased gradually. A significant difference was found among the 8 sequences (P < .05, Friedman test). Significant differences were found in pair-wise comparison except between RS and CS2, between SF2 and CS4, between SF4 and CS8 or CS10, between CS4 and CS6, and between CS8 and CS10 (Online Supplemental Data). SF4, CS8, and CS10 were considered unacceptable for the visibility of the SN-RN because their mean scores were <2.
Visibility of ICV.
The mean score for the visibility of the ICV was the highest in SF2 and the lowest in CS10 among the 8 SWI sequences (Online Supplemental Data). As the CS-SENSE factor increased, the mean score decreased gradually, showing a significant difference among the 8 sequences (P < .05, Friedman test). Significant differences were found in pair-wise comparisons except for between RS and SF2 or CS2, between SF2 and CS2, between SF4 and CS6, between CS2 and CS4, and between CS8 and CS10 (Online Supplemental Data). SF4, CS6, CS8, and CS10 were considered unacceptable for the visibility of the ICV because their mean scores were all <2. As for CS-SENSE-accelerated SWI sequences, the boundary of the ICV became fuzzy in CS6, CS8; and CS10, and the anatomy of the ICV was even unrecognizable in CS10 (Fig 2N).
Visibility of the BA.
The mean scores for the visibility of the BA were all >2 in the 8 SWI sequences (Online Supplemental Data), and the BA was well-distinguished in images by each of the 5 CS-SENSE-accelerated SWIs (Fig 2B–F). As the CS-SENSE factor increased, the mean score decreased slightly and gradually. A significant difference was found among the 8 sequences (P < .05, Friedman test). As for paired comparisons, the difference was found only between RS and SF4, CS8, or CS10, between SF2 and CS8 or CS10, between CS2 and CS6, CS8, CS10 or SF4, and between CS10 and CS4 or CS6 (Online Supplemental Data).
Detection and Counting of CMBs.
CMBs of all 25 patients were detected by the 2 readers on images using each of the 8 SWI sequences (examples of the CMBs are shown in Fig 2A–H). In total, 87 CMBs were counted by readers 1 and 2 independently in images of each of the 8 SWI sequences. No significant difference was found for the detection or counting of the CMBs among the 8 SWI sequences (P > 0.99, Friedman test).
Diagnostic Confidences of Other Intracranial Diseases.
The diagnosis of other intracranial lesions demonstrated 100% agreement among either the 8 SWI sequences or the readers. The diagnosis included the 3 cases of cavernous angiomas (Fig 3A–H), the 9 cases of intracranial gliomas (Fig 3I–P), the 5 cases of venous malformation (Fig 4A–H), and the case of subacute hemorrhage with peripheral hemoglobin deposition (Fig 4I–P). Valuable information about these lesions was provided even in the CS10 SWI.

Visualization of the cavernous angiomas (A–H, indicated by the oblique arrows) and the intracranial gliomas (I–P, indicated by the horizontal arrows) in the 8 susceptibility-weighted images.

Visualization of the venous malformation (A–H, indicated by the horizontal arrows) and the subacute hemorrhage with peripheral hemoglobin deposition (I–P, indicated by the vertical arrows) in the 8 susceptibility-weighted images.
DISCUSSION
In this study, the CS-SENSE technique with 5 different acceleration factors was evaluated on brain SWI in a cohort of 99 patients with images collected from 5 centers. A reference sequence without acceleration and 2 sequences using the conventional SENSE technique were included for comparison. CS-SENSE with an acceleration factor of 10 was found as a feasible option for distinguishing the BA, detecting the CMBs, and providing valuable information on the diagnosis of cavernous angiomas, intracranial gliomas, venous malformation, and subacute hemorrhage. However, for better visualization of structures including both the SN-RN and ICV, we recommended that the CS-SENSE factor not be higher than 4.
Reduced image quality was observed from both the quantitative measurements (the tendency of the SNR and CR) and visual image evaluation (the tendency of scores for overall image quality and visualization of the SN-RN, BA, and ICV) when the SENSE or CS-SENSE acceleration factor increased, a result that was reasonable due to the sparser data sampling in the higher SENSE or CS-SENSE acceleration factor. This outcome was also observed in a previous multicenter study for 3D TOF-MRA.24 The quantitative measurements and scores for overall image quality of CS2 slightly (not statistically significantly) outperformed those of the RS scan, possibly attributed to the reduced physiologic motion as a result of the shortened scan time. Considering the quantitative measurements and scores for overall image quality, CS2 and CS4 could provide comparable image quality compared with RS; the CS4 with shorter scan time was thought to be a suitable option in practice.
Susceptibility-mapping techniques provide quantitative measures of magnetic susceptibility, which shed additional light on brain development, aging, and evolution of pathologies, but they are still primarily in the research stage rather than a commonly used protocol.26 Preferential iron accumulation in SN and/or RN was associated with some neurodegenerative disorders such as Parkinson disease, Alzheimer disease, and multiple sclerosis.21,27,28 It was recently reported that 3D multiecho SWI of the substantia nigra at 7T may be used to accurately differentiate healthy subjects from patients with Parkinson disease.29 Although a difference was found for the visibility of SN-RN between CS4/CS6 and RS, which was mainly because the boundary of SN-RN was not as clear in CS4/CS6 as in RS, the score in CS4/CS6 was >2, indicating acceptable image quality for diagnosis. Notably, visualization of the SN-RN became rough and fuzzy when the CS-SENSE factor was >6, which was thought to be unacceptable according to the criterion for the scores in this study. Thus, for a better visibility of the SN-RN on SWI, we recommend that the CS-SENSE acceleration factor not be >6.
Providing high-resolution delineation of the cerebral venous architecture is another advantage of SWI, which makes it widely applied in the diagnosis of various venous abnormalities.3 CS4 demonstrated acceptable image quality for the visualization of the ICV (mean score = 2.27), though the difference was in the scoring on the ICV between CS4 and RS. CS6, CS8, and CS10 were considered unacceptable for the visibility of ICV in this study, and the boundaries of the ICV in images in CS6, CS8, and CS10 became fuzzier than those in images in CS2 and CS4. Particularly, the anatomy of the ICV became unrecognizable in images in CS10. Notably, 5 cases of venous malformation in this study were well-recognized in all susceptibility-weighted images, even in images in CS10. The possible reasons might be that the venous malformations in this study were all venous enlargements or abnormal clustered veins, which were easier to observe despite unclear boundaries in images with high CS-SENSE factors. Therefore, when more details of the intracranial veins (ICV, and so forth) are needed, we recommend a CS-SENSE acceleration factor of up to 4 in practice, though CS10 can also provide valuable information for detecting the venous malformations.
Susceptibility artifacts near the air-bone interface in SWI were thought to influence the visualization of the BA and both temporal lobes.13 No prominent visual difference was found for the susceptibility artifacts near the air-bone interface among the 8 SWI sequences in this study, and the visibility of the BA in the SWI was not obviously affected by increased CS-SENSE acceleration factors. Previous studies have proved that SWI was valuable in detecting cerebral cavernous malformations,30 providing indispensable information in the diagnosis and preoperative grading of gliomas31 and identifying deoxyhemoglobin, methemoglobin, and hemosiderin presenting in the hematoma at different stages.32 In this study, we found that different acceleration factors had no remarkable influence on the detection of the CMBs, cavernous angiomas, intracranial gliomas, venous malformation, and subacute hemorrhage. Therefore, we suggest that the fast SWI (41 seconds) based on the CS-SENSE factor of 10 could be reliable in daily practice for screening the above-mentioned diseases, especially for patients who cannot cooperate for a relatively long scan time or for severely ill patients needing emergency treatment, a practice used in our hospital.
SENSE, as one of the parallel imaging techniques, was commonly used in clinical practice for fast SWI with an acceleration factor of 2.33 Results using SF2 in this study, with the scan time of 177 seconds, showed high SNR and CR; excellent visibility of SN-RN, BA and ICV; good detection of CMBs; and valuable diagnostic information for other intracranial diseases, which proved its effectiveness in brain SWI. Results using CS4 were almost equivalent to these using SF2, but with a further shortened scan time of 102 seconds, which makes CS4 an appealing alternative to SF2 for SWI in practice. On the other hand, regarding SF4, although the scan time was reduced to 88 seconds, its overall performance was much worse than that of CS4, and the overall image quality and visibility of the SN-RN, BA, and ICV became unacceptable. Even for CS6, for which the scan time was further shortened (68 seconds), the SNR and CR were higher than those of SF4 and all visual scores were also higher. These observations suggested the use of higher acceleration factors with CS-SENSE in SWI in the clinical setup than with conventional SENSE, consistent with a previous study for TOF-MRA.24
The current study has several limitations. First, only the ICV, which was selected as representative of the small brain vessels, was evaluated for the performance of the intracranial veins, while more veins with smaller sizes or in different brain areas should be evaluated in a further study. Second, the sample size was relatively small for more accurate assessment of the patients with abnormal findings with CMBs, cavernous angiomas, intracranial gliomas, venous malformations, and subacute hemorrhage. Meanwhile, further research is needed to explore how the CS-SENSE works in more specific situations, such as ultrashort stroke protocols, neurosarcoidosis, multiple sclerosis, and dural fistulas. Third, the number of iterations in the CS reconstruction that might have influenced the image quality was not included as a study subject. Fourth, the acceleration factors recommended in this study were based on results from MR imaging scanners with a magnetic field strength of 3T and with the 32-channel head coil (specified in the Materials and Methods section) and with the specific setting of scanning parameters (resolution, TR, TE, and so forth). Because these hardware conditions and parameter settings should both impact the optimal CS-SENSE acceleration factor for SWI, further reporting on the generalized use of CS-SENSE while varying clinical scenarios is still desired.
CONCLUSIONS
CS-SENSE factor 4 is recommended for routine practice with balanced image quality and acquisition time. CS-SENSE factor 10 could be a fast surrogate for distinguishing the BA and detecting susceptibility-related abnormalities (eg, CMBs, cavernous angiomas, gliomas, and venous malformations) in which SN-RN and ICV visualizations are less weighted in patients (eg, patients with critical conditions who move) who cannot tolerate the scan time of CS-SENSE factor 4.
Footnotes
Bing Zhang and Guiqing Zhang are senior authors.
This work was supported by the National Science Foundation of China (Nos. 81870958 and 81571631), the Beijing Natural Science Fund (No.7133244), and the Beijing Nova Program (xx2013045).
Disclosure forms provided by the authors are available with the full text and PDF of this article at www.ajnr.org.
Indicates open access to non-subscribers at www.ajnr.org
References
- 1.
- 2.
- 3.
- 4.
- 5.
- 6.
- 7.
- 8.
- 9.
- 10.
- 11.
- 12.
- 13.
- 14.
- 15.
- 16.
- 17.
- 18.
- 19.
- 20.
- 21.
- 22.
- 23.
- 24.
- 25.
- 26.
- 27.
- 28.
- 29.
- 30.
- 31.
- 32.
- 33.
- Received August 11, 2021.
- Accepted after revision October 17, 2021.
- © 2022 by American Journal of Neuroradiology