Abstract
BACKGROUND AND PURPOSE: Intravoxel incoherent motion MRI has been proposed as an alternative method to measure brain perfusion. Our aim was to evaluate the utility of intravoxel incoherent motion perfusion parameters (the perfusion fraction, the pseudodiffusion coefficient, and the flow-related parameter) to differentiate high- and low-grade brain gliomas.
MATERIALS AND METHODS: The intravoxel incoherent motion perfusion parameters were assessed in 21 brain gliomas (16 high-grade, 5 low-grade). Images were acquired by using a Stejskal-Tanner diffusion pulse sequence, with 16 values of b (0–900 s/mm2) in 3 orthogonal directions on 3T systems equipped with 32 multichannel receiver head coils. The intravoxel incoherent motion perfusion parameters were derived by fitting the intravoxel incoherent motion biexponential model. Regions of interest were drawn in regions of maximum intravoxel incoherent motion perfusion fraction and contralateral control regions. Statistical significance was assessed by using the Student t test. In addition, regions of interest were drawn around all whole tumors and were evaluated with the help of histograms.
RESULTS: In the regions of maximum perfusion fraction, perfusion fraction was significantly higher in the high-grade group (0.127 ± 0.031) than in the low-grade group (0.084 ± 0.016, P < .001) and in the contralateral control region (0.061 ± 0.011, P < .001). No statistically significant difference was observed for the pseudodiffusion coefficient. The perfusion fraction correlated moderately with dynamic susceptibility contrast relative CBV (r = 0.59). The histograms of the perfusion fraction showed a “heavy-tailed” distribution for high-grade but not low-grade gliomas.
CONCLUSIONS: The intravoxel incoherent motion perfusion fraction is helpful for differentiating high- from low-grade brain gliomas.
ABBREVIATIONS:
- D
- diffusion coefficient
- D*
- pseudodiffusion coefficient
- f
- perfusion fraction
- fD*
- flow-related parameter
- IVIM
- intravoxel incoherent motion
An estimated 69,720 new cases of primary central nervous system tumors are expected to be diagnosed in the United States in 2013, of which an estimated 24,620 new cases will be malignant (13,630 in males and 10,990 in females).1 The 5-year relative survival rate following diagnosis of primary malignant CNS tumors, mostly gliomas, is poor, with an average of 33.8%, but it is age-dependent, decreasing monotonically from 73% for 0–19 years of age to 10% for 65–74 years of age (data from 1995–2009).2
The assessment of perfusion characteristics of those lesions by using dynamic susceptibility MR imaging has become an important part of the initial evaluation and follow-up because cerebral blood volume has been shown to correlate with the degree of neovascularization3 and increased local perfusion has been shown to correlate with tumor grading4 and prognosis.5 Histologically, the assessment of microvascularity is important for the grading of a primary brain tumor6 because high-grade neoplasms produce a pathologic microvascular network through neoangiogenesis to satisfy a growing need for nutriments and oxygen.
Le Bihan et al7 have proposed measuring microvascular perfusion with an MR imaging–based method called intravoxel incoherent motion (IVIM) imaging. The incoherent motion of spins, which can be understood as the spatial “mixing” of spins during the time of measurement, reduces exponentially the signal amplitude obtained from a diffusion-weighted sequence such as the Stejskal-Tanner sequence.8 This incoherent motion arises inevitably from the thermal diffusion characterized by diffusion coefficient (D) and, in biologic perfused tissue, from movements of blood in the microvasculature, called by analogy pseudodiffusion and characterized by pseudodiffusion coefficient (D*).
Therefore, an IVIM biexponential signal equation7 has been proposed to model incoherent motion in biologic tissue, with the perfusion fraction (f) describing the fraction of incoherent signal arising from the vascular compartment in each voxel over the total incoherent signal. Furthermore, under the assumption of an isotropic, randomly laid microvascular network, a linear relationship were derived9 between D* and fD* (the scalar multiplication of f and D*, referred to as the flow-related parameter) and CBV, MTT−1, and CBF, respectively.
Recently, IVIM showed promising results in helping discriminate high- and low-grade tumors, for example in the salivary gland, among Warthin tumors, pleomorphic adenomas, and malignant tumors10; in the pancreas between healthy pancreas and pancreatic cancer11; or between renal12 and breast tumor subtypes.13 In the brain, where initial reports were made,7,14⇓⇓⇓⇓–19 IVIM perfusion parameters showed recently a gradual increase in response to gradual increase of hypercapnia.20
The purpose of this study was to evaluate the utility of IVIM perfusion parameters (f, D*, and fD*) to differentiate high- and low-grade brain gliomas.
Materials and Methods
Patient Demographics
The present study was approved by the local ethics committee at University of Lausanne. Patient consents were waived. From May 2011 to December 2012, our clinical glioma protocol included an IVIM sequence, which replaced the standard diffusion-weighted sequence. This provided apparent diffusion maps, which are part of the standard glioma evaluation, as well as perfusion-weighted maps, which allowed our exploratory work. Our clinical glioma protocol also included T1-weighted, T2-weighted, DSC perfusion, and T1-weighted postgadolinium sequences. Twenty-one consecutive patients (17 males, 4 females; mean age, 52.3 ± 21.3 years; age range, 2–84 years; Table 1) who had preoperative MR imaging examination, had no relevant treatment history at the time of imaging (such as radio-, chemo-, or antiangiogenic therapy), and had consecutive histopathologic diagnoses were included in the study. The tumor grading was based on World Health Organization criteria and yielded 16 high-grade and 5 low-grade gliomas. Because of the low number of low-grade gliomas found, a complementary study was performed and included 6 further low-grade gliomas diagnosed on radiologic criteria only (On-line Appendix).
Patient demographics, tumor localization, and histologic diagnosis
Conventional MR Imaging
Conventional MR imaging, DSC, and IVIM were performed during the same procedure to allow direct comparison. The imaging was performed on 3T MR imaging scanners (Trio, Verio, or Skyra; Siemens, Erlangen, Germany) equipped with 32 multichannel receiver head coils. Before the examination, an 18- to 20-ga needle was inserted in either the right or the left antecubital vein. Afterward, T1-weighted sagittal and T2-weighted axial images were acquired.
IVIM MR Imaging
A Stejskal-Tanner diffusion-weighted spin-echo EPI pulse sequence15 was used, with multiple b-values (0, 10, 20, 40, 80, 110, 140, 170, 200, 300, 400, 500, 600, 700, 800, 900 s/mm2) in 3 orthogonal directions, and the corresponding trace was calculated. A single acquisition was obtained (no average). The images were orientated axially with a section thickness of 4 mm, an FOV of 297 × 297 mm2, and a matrix size of 256 × 256, yielding an in-plane resolution of 1.2 × 1.2 mm2. Parallel imaging, with an acceleration factor of 2 and a 75% partial Fourier encoding allowed TR/TE = 4000/99 ms. The receiver bandwidth was 1086 Hz/pixel, and fat was suppressed with a spectrally selective saturation routine. Total acquisition time was 3 minutes 7 seconds.
DSC MR Imaging
A gadolinium-based agent (gadoterate meglumine, Dotarem; Guerbet, Paris, France) was intravenously injected at a dose of 0.2 mL per kilogram of body weight and at a rate of 3 mL/s, followed by a 20-mL saline flush. Standard echo-planar images were consecutively acquired (TR = 1950 ms, TE = 43 ms, section thickness = 6 mm, FOV = 230 × 230, acquisition matrix = 128 × 128). No leakage correction was performed. CBV, MTT, and CBF maps were computed from the DSC MR imaging data by using the commercially available software, syngoMR (Siemens). On the section of interest, a region of interest was placed on an identified artery. We selected ≥4 voxels containing the best arterial input function curves, from which the average was built. We then set the time ranges defining baseline, gadolinium entry, and recovery, before the DSC perfusion maps were automatically calculated on the basis of a γ variate fitting of the time-concentration curve.
Regions of Interest
Brain gliomas have very heterogeneous structures and, accordingly, only the region with the highest malignancy defines the pathologic grade of the lesion. Therefore, a region of interest was manually placed on each tumor area in consensus by 2 experienced neuroradiologists (P.M. and P.H.) who were blinded to the histopathology, in the region of the tumor with maximal IVIM perfusion fraction and in the contralateral white matter, both on a single axial section. Cystic, hemorrhagic, or necrotic areas were avoided by using conventional pre- and postcontrast MR images. If a tumor was centered on the midline, a region of interest was chosen in the white matter of one of both hemispheres. Mean IVIM region-of-interest size was 322 ± 187 mm2. The corresponding ROIs were then drawn on the DSC images, manually matching the images by using anatomic landmarks. The relative CBV was calculated by dividing the value of the region of interest in the tumor by the value of the contralateral normal-appearing white matter. The mean DSC region-of-interest size was 342 ± 151 mm2.
We also produced histograms by placing a region of interest on all whole tumors on the IVIM b0 images, including all sections where the tumor was visible, and encompassing as much of the tumor area as possible but excluding cystic or necrotic areas, with the help of conventional pre- and postcontrast MR images. For the control histogram, a region of interest was placed in all patients to comprise the full white matter of an axial section of the contralateral hemisphere to the tumor.
All ROIs were placed so that they included as little CSF or as few large vessels as possible.
IVIM Image Processing
The standard IVIM 2-compartment diffusion model was assumed,7 with a “microvascular” and a “nonvascular” compartment, having, respectively, a pseudodiffusion coefficient and an apparent diffusion coefficient. The percentage of incoherent signal arising from the microvascular compartment f is called the perfusion fraction. To obtain the IVIM parameters, the IVIM signal equation
 was fitted in 2 steps, as previously described,20 first for b > 200 s/mm2 for the single parameter D, then for all b and all parameters, while keeping D constant. This fit was done on a voxel-by-voxel basis, by using the Levenberg-Marquardt algorithm21 implemented within Matlab (MathWorks, Natick, Massachusetts). This 2-step method increases robustness under biologic conditions and assumes that D* is significantly greater than D22 so that the influence of pseudodiffusion on signal decay can be neglected for b-values > 200 s/mm2. Values under 0 for f, D, and D*, and values with f > 0.3 and D* > 0.05 mm2/s were considered not physiologic and were set to 0.23 This step excluded poorly fitted voxels (< 1% of the voxels) and was necessary to ensure that a single artifactually very high value in a single voxel could not be responsible for the measured effect, while also increasing the contrast of the IVIM maps.
Statistical Analysis
Statistical analysis was performed with Excel (Microsoft, Redmond, Washington). A normal distribution of the data was assumed. Single-tailed, pair-wise Student t tests were calculated when data were compared with the contralateral region. Single-tailed, 2-sample, unequal-variance Student t tests were calculated between high- and low-grade tumor groups. Statistical significance was defined at P < .05. The Pearson r correlation coefficient between IVIM perfusion fraction f and DSC CBV was calculated.
Results
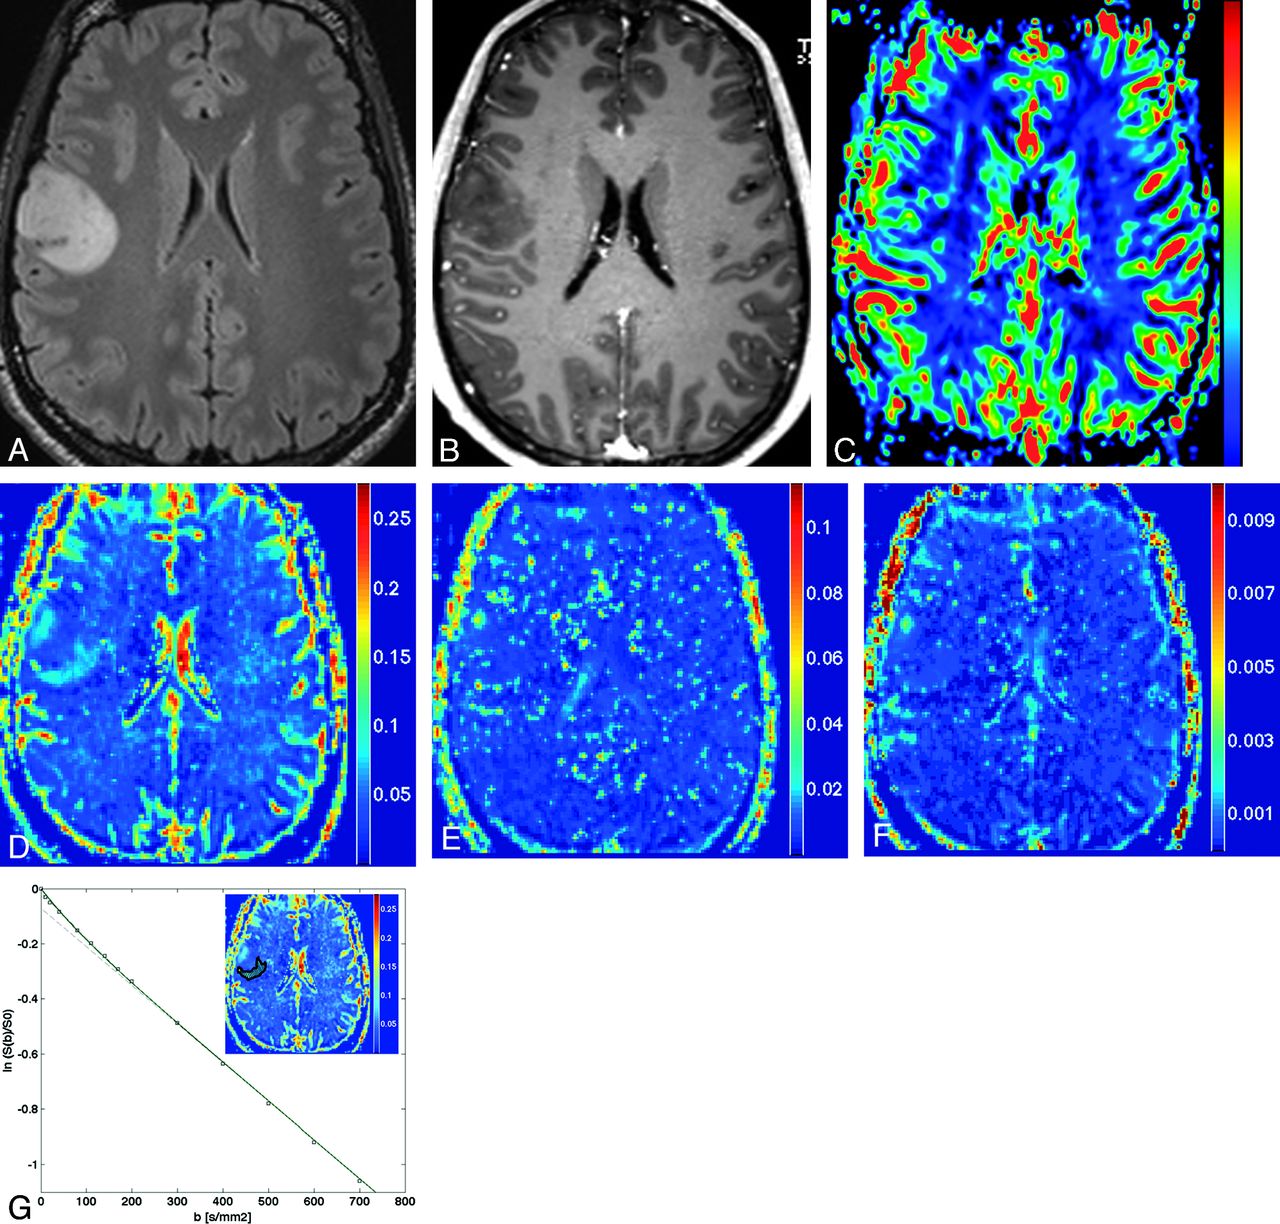
High-resolution IVIM perfusion maps were produced, and in tumorous regions, increased perfusion similar to DSC CBV could be observed (Figs 1 and 2).

A–C, Glioblastoma multiforme involving the paraventricular region of the right frontal lobe seen on axial T2-weighted, T1-weighted postgadolinium, and DSC CBV. D–F, IVIM parametric maps f, D*, and fD* (scale bars: f = unitless; D*, fD* = mm2s−1). G, Logarithmic plot of signal-intensity decay as a function of b of the region of interest of maximal perfusion fraction, with the corresponding biexponential fit.

A–C, Oligoastrocytoma, grade 2, centered on the pre-central gyrus of the right frontal lobe, seen on axial T2-weighted, T1-weighted postgadolinium, and DSC CBV. D–F, IVIM parametric maps f, D*, and fD* (scale bars: f = unitless; D*, fD* = mm2s−1). G, Logarithmic plot of signal-intensity decay as a function of b of the region of interest of the maximal perfusion fraction, with the corresponding biexponential fit.
In the region of interest of the maximum IVIM perfusion fraction, f was significantly higher in high-grade (0.127 ± 0.031) compared with low-grade gliomas (0.084 ± 0.016, P = .0006), as well as in both glioma groups compared with the contralateral region (0.061 ± 0.011, P < .0001) (Fig 3). Those results could be confirmed in the complementary study including the cohort of low-grade gliomas diagnosed on radiologic criteria only (On-line Fig 1).

Box-and-whisker plot (median, 25th and 75th percentiles, minimum, maximum, and outliers) of f, D*, fD*, and D, as measured in ROIs of the maximum perfusion fraction. Dark gray indicates high-grade tumors; medium gray, low-grade tumors; light gray, contralateral control region of both high- and low- grade. P values are indicated when <.05.
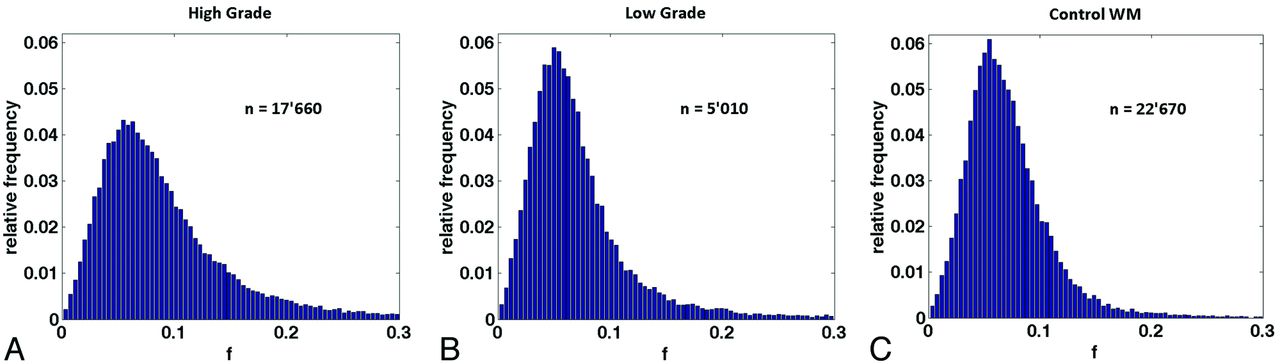
f correlated moderately with DSC relative CBV (r = 0.59, Fig 4). The normalized histogram analysis of f over all whole tumor volumes showed an obvious “heavy-tailed” distribution for the high-grade gliomas in comparison with the low-grade and the reference contralateral white matter of an axial section (Fig 5).

Scatterplots comparing relative DSC CBV (y-axis) with absolute IVIM f (x-axis). Pearson r correlation coefficient is given.

Normalized histograms of the perfusion fraction comprising the voxels of all whole tumor volumes for the high-grade (A) and low-grade (B) groups and for the control group (C). The total number of voxels included is indicated by n. An increase in the normalized number of highly perfused voxels can be observed in the high-grade tumor group in comparison with the low-grade and control groups.
No statistically significant difference was observed for D* (0.0117 ± 0.0058 mm2s−1 versus 0.0114 ± 0.0050 mm2s−1 versus 0.0098 ± 0.0029 mm2s−1, for high-, low-grade, and contralateral brain, respectively; Fig 3). The flow-related parameter fD* was not statistically significantly different between high- and low-grade tumors (0.00132 ± 0.00032 mm2s−1 versus 0.00133 ± 0.00046 mm2s−1, respectively; P = .46), but it was significantly different between both glioma groups and the contralateral brain region (0.00077 ± 0.00007 mm2s−1, P < .001).
Discussion
This report demonstrates that the IVIM perfusion fraction can help differentiate high- and low-grade gliomas. Of interest is the fact that this was obtained with a direct measurement in the tumor, without normalization with a measure in the contralateral white matter, as is currently done with DSC. While more data will be required for a detailed analysis, the following can be deduced from this small cohort: No low-grade tumor showed a value of f above 0.103, suggesting a probable high-grade histology when above this value, with a sensitivity of 75%. No control region showed an f value above 0.096, suggesting tumor when above this value, with a sensitivity of 69%.
Further, f correlated moderately with DSC CBV, confirming earlier results.23 In the histogram analysis of all whole tumors, the heavy-tailed distribution for the high-grade in comparison with the low-grade gliomas and the reference white matter demonstrated that the presented effect can be measured independent of region-of-interest placement.
Single whole-tumor statistical analysis might be of interest but should be explored with care because tumor heterogeneity is a known property of gliomas and the region of highest malignancy defines the tumor grade.
There was no statistically significant difference between D* in the different groups in this small cohort, which might be due to low signal-to-noise ratio. D* has been shown to be less reproducible than f in the liver.24 Nevertheless, in selected cases with high image quality (which was not an inclusion criterion for this study), we were able to produce D* maps that were consistent with the known histologic diagnosis.25 Furthermore, in a larger study with healthy volunteers over large regions of interest, a strong dependence of D* (and no statistically significant dependence of f) on the cardiac cycle could be shown.26 Together, these findings indicate that there is still hope that D* could provide clinically relevant information when image quality is high enough.
There was also no statistically significant difference in D among the different groups. While regions with minimum apparent diffusion coefficient are thought to reflect the sites of highest cellularity within heterogeneous tumors and hence correlate with glioma grade,27⇓–29 those regions do not have to correspond necessarily to the regions of highest vascularity, which were studied here.
The known linear relationship9 between the standard perfusion parameters and the IVIM perfusion parameters is dependent on the structure of the microvascular network, for example, on the mean vascular segment length or on the number and orientation of bifurcations. Neoangiogenic vessels in tumors are known to have a fundamentally different network structure than normal vessels.30,31 This might, therefore, introduce a bias in the comparison with standard perfusion parameters, and further studies evaluating the exact relationship between IVIM and standard perfusion parameters in pathologic conditions should be pursued. The IVIM perfusion parameters should be considered as a new set of microperfusion parameters that, though related to the standard perfusion parameters, might differ in given cases, depending on the local microvascular network structure.
IVIM perfusion measurement in the brain remains technically challenging. It is obviously highly dependent on the immobility of the patient during the entire acquisition. Susceptibility inhomogeneities, such as around the petrous apex or the paranasal sinuses or due to the presence of metal or blood, for example, postoperatively, can harm the IVIM signal but are also problematic when performing DSC.
On the other hand, the IVIM method has many theoretic advantages over currently used DSC. It is intrinsically quantitative, and, because of the intravoxel excitation and readout, it does not require a precise knowledge of the arterial input function, which is challenging to measure.32⇓–34 It does not require contrast media and enables the acquisition of perfusion and diffusion information in a single sequence.
This study has several limitations. The cohort studied is relatively small, especially the low-grade tumors, because those tumors are usually followed without biopsy or operation at our institution. The results of a complementary study, including low-grade tumors as diagnosed on radiologic criteria only, can be found in the On-line Appendix and showed results similar to the ones presented. The placement of the ROIs was subjective in nature but reflected the usual clinical practice. Furthermore, the comparison between IVIM f and DSC CBV is limited by the fact that the DSC sections were positioned in the anterior/posterior commissure plane, while the IVIM sections were placed strictly transverse, but the regions of interest were sufficiently large to be identified reliably by using anatomic landmarks. In the future, the orientation and FOV of the different sequences could be aligned to ease comparison; however, this could be at the cost of optimal parameter settings, which are often sequence-specific. Coregistration and interpolation could improve the accuracy of the correspondence of the regions.
Conclusions
This report demonstrates that the IVIM perfusion fraction might be of value to differentiate high- and low-grade gliomas.
Footnotes
P. Maeder and P. Hagmann contributed equally to this work.
Disclosures: Christian Federau—UNRELATED: Patents (planned, pending or issued): patent pending on IVIM.* Philippe Maeder—UNRELATED: Patents (planned, pending or issued): patent pending on IVIM.* Patric Hagmann—UNRELATED: patents (planned, pending or issued): patent pending on IVIM.* *Money paid to the institution.
This work was supported by the Centre d'Imagerie BioMédicale of the University of Lausanne, University of Geneva, Hôpitaux Universitaires de Genève, Centre Hospitalier Universitaire Vaudois, École polytechnique fédérale de Lausanne and the Leenaards and Jeantet Foundations. C. Federau was supported by the Faculté de biologie et de médecine of the University of Lausanne. P Hagmann was supported by a grant from Leenaards Foundation.
Indicates open access to non-subscribers at www.ajnr.org
References
- 1.
- 2.
- 3.
- 4.
- 5.
- 6.
- 7.
- 8.
- 9.
- 10.
- 11.
- 12.
- 13.
- 14.
- 15.
- 16.
- 17.
- 18.
- 19.
- 20.
- 21.
- 22.
- 23.
- 24.
- 25.
- 26.
- 27.
- 28.
- 29.
- 30.
- 31.
- 32.
- 33.
- 34.
- Received March 30, 2013.
- Accepted after revision June 2, 2013.
- © 2014 by American Journal of Neuroradiology