
Graphical Abstract

Abstract
BACKGROUND AND PURPOSE: Whether differences in the O6-methylguanine-DNA methyltransferase (MGMT) promoter methylation status of glioblastoma (GBM) are reflected in MRI markers remains largely unknown. In this work, we analyze the ADC in the perienhancing infiltration zone of GBM according to the corresponding MGMT status by using a novel distance-resolved 3D evaluation.
MATERIALS AND METHODS: One hundred one patients with IDH wild-type GBM were retrospectively analyzed. GBM was segmented in 3D with deep learning. Tissue with FLAIR hyperintensity around the contrast-enhanced tumor was divided into concentric distance-resolved subvolumes. Mean ADC was calculated for the 3D tumor core and for the distance-resolved volumes around the core. Differences in group mean ADC between patients with MGMT promoter methylated (mMGMT, n = 43) and MGMT promoter unmethylated (uMGMT, n = 58) GBM was analyzed with Wilcoxon signed rank test.
RESULTS: For both mMGMT and uMGMT GBM, mean ADC values around the tumor core significantly increased as a function of distance from the core toward the periphery of the perienhancing FLAIR hyperintensity (approximately 10% increase within 5 voxels with P < 001). While group mean ADC in the tumor core was not significantly different, the distance-resolved ADC profile around the core was approximately 10% higher in mMGMT than in uMGMT GBM (P < 10−8 at 5 voxel distance from the tumor core).
CONCLUSIONS: Distance-resolved volumetric ADC analysis around the tumor core reveals tissue signatures of GBM imperceptible to the human eye on conventional MRI. The different ADC profiles around the core suggest epigenetically influenced differences in perienhancing tissue characteristics between mMGMT and uMGMT GBM.
ABBREVIATIONS:
- AUC
- area under the curve
- GBM
- glioblastoma
- IDH
- Isocitrate dehydrogenase
- MGMT
- O6-methylguanine-DNA methyltransferase
- mMGMT
- MGMT methylated glioblastoma
- PE
- perienhancing FLAIR hyperintensity
- PIZ
- perienhancing infiltration zone
- ROC
- receiver operating characteristic
- SD
- standard deviation
- T1c
- postcontrast T1-weighted image
- TC
- T1 contrast-enhanced tumor
- TCtotal
- tumor core including contrast-enhanced tumor and corresponding necrotic part
- uMGMT
- MGMT unmethylated glioblastoma
SUMMARY
PREVIOUS LITERATURE:
MGMT promoter methylation status of GBM correlates with longer progression-free survival and overall survival. Therefore, efforts have been made to predict MGMT methylation status from MRI to complement histopathologic analysis. However, whether differences in MGMT promoter methylation are reflected in MRI markers remains largely unknown. To date, preoperative characterization of the perienhancing infiltration zone in GBM remains challenging, and little is known about its imaging characteristics. In addition, it was significantly less studied than the visible tumor core due to the lack of image analysis methods for volumetric 3D evaluation.
KEY FINDINGS:
ADC values around the contrast-enhanced tumor significantly increase as a function of distance from the tumor core toward the periphery of the perienhancing FLAIR hyperintensity. The distance-resolved ADC profile around the tumor core was significantly different between MGMT methylated and unmethylated GBM.
KNOWLEDGE ADVANCEMENT:
We provide new insights into the evaluation of perienhancing zone in GBM by introducing a novel volumetric and distance-resolved approach. We show that MGMT methylation status in the perienhancing zone is associated with different distance-resolved ADC signatures and that MGMT status estimation seems to be feasible with MRI.
Glioblastoma (GBM) is the most common brain tumor in adults, with a median overall survival of only 15 months despite multimodal therapy.1 The molecular characteristics of the tumor and the surgical component of the therapy are critical for the patient’s response to radiation therapy and chemotherapy. Silencing of the O6-methylguanine-DNA methyltransferase (MGMT) gene by promoter methylation increases the efficacy of temozolomide and has become an important biomarker to predict tumor resistance or sensitivity to chemotherapy.2⇓⇓⇓-6 MGMT promoter methylation status of GBM correlates with longer progression-free survival and overall survival.2⇓⇓⇓-6 In addition, pseudoprogression after radiation and chemotherapy is more common in tumors with MGMT promoter methylation, which should be considered when interpreting treatment response on follow-up MRI.7
Currently, the determination of the MGMT promoter methylation status requires tissue sampling, which is obtained through surgical tumor resection or biopsy. In general, the resection, which is commonly the first step of the treatment, is conducted without any molecular information about the tumor, including no information about the MGMT promoter methylation status. In addition, MGMT promoter methylation status in recurrent GBM may change during treatment.8,9 Therefore, efforts have been made to predict MGMT methylation status from MRI to complement histopathologic analysis. However, whether differences in MGMT promoter methylation are reflected in MRI markers remains largely unknown.
In general, GBM shows infiltrative growth and tumor cell migration from the inside out.10⇓⇓⇓-14 It is characterized by the presence of a biologically highly complex diffuse perienhancing infiltration zone (PIZ) around the T1 contrast-enhanced tumor (TC) and the absence of clear tumor boundaries. The PIZ represents the main site of progression and its cellular composition is thought to influence aggressiveness, invasion, and recurrences significantly.15⇓-17 More than 80% of GBM cases are characterized by local progression, in which tumor recurrence appears within 2–3 cm of the resection margin.18,19 Although not enhancing on postcontrast T1-weighted images (T1c), the tissue in the immediate vicinity around the edge of the TC with hyperintensity on FLAIR images is a mixture of PIZ and pure edema as the infiltrating cells’ spread exceeds the TC and infiltrates into the surrounding tissue.15,20 It has been shown that tumor cell attenuation and alteration of the extracellular matrix due to tumor infiltration is higher in the proximity of TC than at a greater distance from it.15,20 These aspects suggest that the distance to the TC may be an important determinant of tissue composition and tumor cell attenuation of the PIZ. Therefore, there is an increasing need to characterize volumetric MRI markers around the TC as a function of distance from it.
Quantitative MRI, such as the ADC, is more sensitive to changes in tissue composition on the cellular level than conventional MRI.21 Constriction of the extracellular space by swelling or increased cellularity affects the ADC values, which are influenced by tumor cell attenuation, necrosis, and vasogenic edema.21⇓⇓⇓⇓-26 In GBM, TC has regional low ADC values due to its relative high cellularity that decreases the available extracellular space for water movement, while the relative high ADC in perienhancing FLAIR hyperintensity reflects the increased fluidity in the tissue caused by vasogenic edema.22,27,28 ADC values before treatment were associated with the overall survival of patients with GBM,24,29⇓⇓⇓⇓-34 while the usefulness of ADC for predicting MGMT promoter methylation status has shown conflicting results.35⇓⇓⇓⇓⇓-41 Several studies found a correlation between ADC values and MGMT promoter methylation status,35,38⇓⇓-41 while others did not measure any correlation.36,37
Only a small number of studies analyzed ADC or other quantitative MRI markers in the PIZ of GBM,39,42,43 as most published studies concentrated on the TC. The contradictory results from the literature suggest that the possible ADC differences between MGMT promoter methylated (mMGMT) and MGMT promoter unmethylated (uMGMT) GBM, if they exist at all, are extremely small. According to our interpretation, the visible tumor core (contrast-enhanced tumor and corresponding necrotic part) is less important in this context than the perienhancing zone. The tumor core is commonly removed by surgery and is an unsalvageable area with abnormally disturbed ADC due to the combination of an extremely high tumor cell attenuation and corresponding necrosis. Therefore, we hypothesized that the perienhancing zone, which is a biologically active area in terms of tumor growth14,15 and is not completely dominated by the tumor, is a better candidate. In addition, we hypothesized that dividing the perienhancing zone into relatively small subvolumes by using a relatively large distance resolution would increase the sensitivity of the analysis.
The overall aim of this paper is 2-fold: 1) introduce a methodology for 3D distance-resolved analysis of the PIZ in GBM and 2) investigate the ADC characteristics of the PIZ. To this end, we divided the perienhancing FLAIR hyperintensity into concentric distance-resolved subvolumes around the TC (in an onion-skin manner) and investigated the distance-resolved ADC profile of the FLAIR hyperintensity in 2 GBM groups with different MGMT characteristics (methylated versus unmethylated GBM).
MATERIALS AND METHODS
Patients
A retrospective analysis of 201 patients treated within our institution between 2018 and 2022 was performed. Main inclusion criteria were: 1) known MGMT methylation status determined according to Bady et al;44 2) availability of T1, T1 postcontrast (T1c), T2, and FLAIR preoperative MRI and corresponding DWI with ADC measured with the same 3T scanner; 3) visually apparent T1-contrast-enhanced tumor (TC) on T1c; and 4) larger than 1000 mm3 volume for TC and perienhancing FLAIR hyperintensity as measured with our image analysis pipeline (see Imaging). WHO grade 4 IDH-mutant astrocytomas were also excluded, as they respond significantly better to therapy than IDH wild-type GBMs. Seventy-four patients had preoperative MRI either outside of our institution or were measured within our institution with a different scanner provider (GE Healthcare and Phillips) and brain tumor imaging protocol than the Siemens protocol used for this study and were also excluded. Figure 1 shows the patient-selection protocol and criteria for inclusion and exclusion. All tumors were newly diagnosed, imaging was performed before resection, and none of these patients received any treatment before imaging (no radiation therapy, no chemotherapy, no treatment-related drugs). Histopathologic reports were available for all patients, and the diagnosis of GBM without IDH mutation was confirmed after surgery. IDH1/2 mutation status was analyzed by the next-generation sequencing-based Oncomine Comprehensive Assay v3, DNA-part (Oncomine Comprehensive Assay v3M, thermofisher.com). The study protocol (ethical application number 2022-00041) conforms to the ethical guidelines of the Declaration of Helsinki. The study was conducted according to the Standards for Reporting of Diagnostic Accuracy Studies (STARD) guidelines.45

Patient-selection protocol and criteria for inclusion and exclusion.
Imaging
Representative T1, T1c, FLAIR, T2, and ADC images of our clinical protocol obtained in patients with mMGMT and uMGMT are shown in the Online Supplemental Data. MRI was performed on a 3T (Skyra; Siemens) scanner by using a 32-channel head coil (Siemens). The clinical protocol consisted of precontrast native 3D T1, transversal 2D T2, transversal 2D ADC, 3D FLAIR, and 3D T1c after contrast agent administration. ADC was measured with a 2D spin-echo echo-planar imaging sequence by using segmented k-space readout (RESOLVE, Siemens): FOV of 220 × 220 mm, number of slices 34, image size 190 × 190 voxels, voxel size of 1.2 × 1.2 mm with 3 mm slice thickness, 2 b-values (0 with TE = 71 ms and 1000 with TE = 117 ms), TR = 7220 ms, GRAPPA acceleration factor of 2 with 5 readout segments. Total measurement time was 4:29 minutes. Quantitative ADC maps based on the measured b-values were generated automatically by the scanner.
Image Processing and Statistical Analysis
Postprocessing and statistical analysis were done with Python 3.16 (Python Software Foundation) and Matlab 2022 (MathWorks). All images were resampled to a uniform 256 × 256 × 220 matrix size with 1 mm isotropic resolution and coregistered to each other by using dipy (dipy.org).46
Online Supplemental Data show representative segmentation of GBM in 1 patient. GBM was segmented into TC, necrotic tumor (NT), tumor core (TCtotal = TC + NT), and perienhancing FLAIR hyperintensity (PE, including the entire volume around the TCtotal with FLAIR hyperintensity) by a semiautomatic approach. A standard U-Net model47 was trained on the BraTS 2022 data set48 containing MRI of 1140 presegmented patients with high-grade gliomas. Images were resampled to the same matrix size with 1-mm isotropic resolution as our clinical images. The model was trained in a slice-wise fashion in 2D by using 4 contrasts for each slice position: T1, T2, FLAIR, and T1c. GBM was automatically segmented by this model and, if necessary, manually corrected in 3D Slicer.49 Automatic tumor segmentation was evaluated and corrected by consensus between N.H. and G.B. Each 2D transversal slice of the GBM volume was segmented to obtain a complete 3D segmentation of the entire GBM volume.
For perienhancing tissue analysis, the subvolume of PE up to a distance of 5 voxels around the TCtotal, which was the nonenhancing component of the perienhancing FLAIR hyperintensity with radiologic changes due to edema and possible tumor infiltration, was considered in this study. Figure 2 illustrates the generated subvolumes of PE around the TCtotal, which can be interpreted as the hypothetical edges of the PIZ in PE. The PE volume up to a distance of 5 voxels was divided into 5 1-voxel wide subvolumes (from PIZ1 to PIZ5 with 1 voxel increment) by using the VTK toolkit in Python (pypi.org/project/vtk/).50 The total PIZ volume (PIZtotal) was the union of the distance-resolved subvolumes (PIZtotal = PIZ1∪PIZ2∪PIZ3∪PIZ4∪PIZ5).

Generated subvolumes of perienhancing infiltration zone (PIZ) in perienhancing FLAIR hyperintensity around the tumor core in 2D (A and B) and in 3D (C). Black arrows (A) show perienhancing tissue without radiologic signs of tumor infiltration. Red arrows (A) show the PE in which the PIZ subvolumes were generated. Dark areas on FLAIR containing fluid with relatively high ADC values, such as the ventricles or brain folds, were not included in the PE and, therefore, excluded from the PIZ analysis. B, The same tumor as in (A) for different slice positions, is visualized in 3D in (C). The distance between the margin of the tumor core and PIZ1, PIZ2, PIZ3, PIZ4, and PIZ5 is 1, 2, 3, 4, and 5 voxels with 1-mm isotropic resolution, respectively.
Mean ADC for the generated segments were computed for each patient separately by using: 1) each voxel in the segment; 2) voxels with 20th percentile of lowest ADC values (ADClow) representing tissue with high cellularity; and 3) voxels with 20th percentile of highest ADC values (ADChigh) representing tissue with increased fluidity. Group mean ADC (based on 43 mMGMT and 58 uMGMT patient-resolved mean values) for TCtotal, TC, PIZtotal, and distance-resolved PIZ volumes were compared between mMGMT and uMGMT tumors. Correlation between distance and mean ADC around the TC was analyzed by Spearman rank correlation coefficient. Significance analysis was done by the 2-sided Wilcoxon-Mann-Whitney-test. For P values less than .05, differences were considered as significant.
The receiver operating characteristic (ROC) curves and corresponding area under the curve (AUC) were determined 1) by using a single ADC threshold based on PIZtotal and 2) by using an ADC threshold for each distance-resolved PIZ subvolume separately and majority voting. The threshold values were determined as group mean ADC value of mMGMT in the 3D segment minus 50% of the standard deviation (SD): threshold = mean(ADCmMGMT) – (SD × 0.5). Tumors with mean ADC below the threshold were classified as uMGMT. Using the 5 PIZ subvolumes, MGMT status was determined by using majority voting. For example, if in PIZ1, PIZ2, and PIZ3 ADC was below the corresponding threshold (3 votes for uMGMT) and in PIZ4 and PIZ5 above the corresponding threshold (2 votes for mMGMT), the tumor was classified as uMGMT.
RESULTS
Figure 3 shows representative mMGMT and uMGMT cases and corresponding distance-resolved ADC. There were no significant differences in group mean ADC values in the TC and TCtotal between mMGMT and uMGMT tumors. In contrast, group mean ADC in PIZtotal (including all 5 subvolumes) was approximately 9% higher in mMGMT than in uMGMT GBMs (1431 ± 205 versus 1313 ± 179 × 10−6mm2/s, with P = .04, Fig 4B, Table).

Representative mMGMT and uMGMT cases. A, Tumor segmentation and the corresponding distance-resolved subvolumes of the perienhancing FLAIR hyperintensity. Dark areas on FLAIR containing fluid with relatively high ADC values, such as the ventricles or brain folds, were not included in the PE and, therefore, excluded from the PIZ analysis, as indicated by the red arrows. B, The corresponding distance-resolved ADC evaluation around the tumor core (mean ± SD).

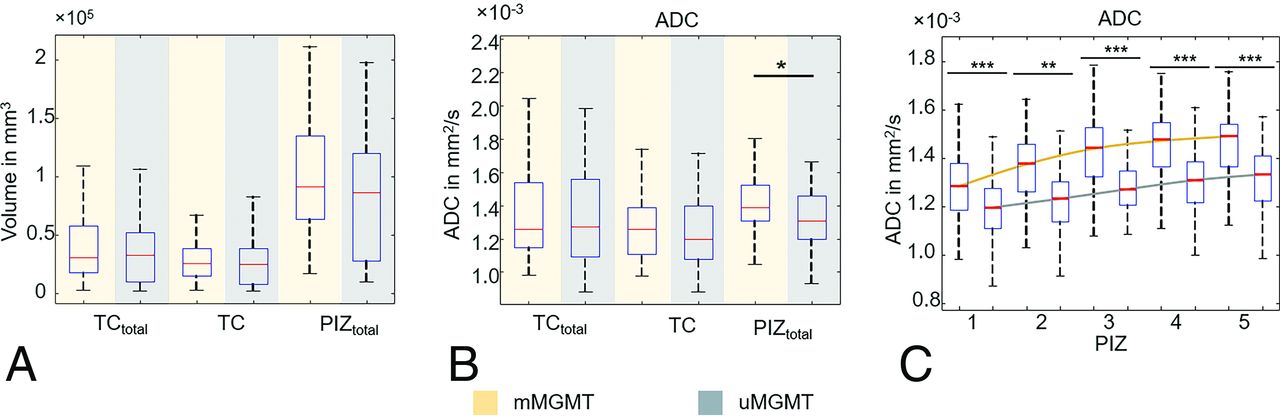
Volumetric analysis of mMGMT and uMGMT GBM. A, Volume of the total tumor core (TCtotal), T1-contrast-enhanced tumor (TC), and perienhancing infiltration zone containing all 5 distance-resolved PIZ segments (PIZtotal) was not significantly different between mMGMT and uMGMT. B, Group mean ADC in TCtotal and TC show no statistically significant differences between mMGMT and uMGMT while group mean ADC in the PIZtotal was significantly higher in mMGMT than in uMGMT. C, Distance-resolved volumetric ADC analysis around the tumor core. For both mMGMT and uMGMT, ADC increased significantly as a function of distance from the neighboring zone of TCtotal (PIZ1) toward the zone at 5 voxel distance from it (PIZ5). Spearman p for correlation analysis between ADC and distance from the tumor core is everywhere under 10−10. P < .05, P < .005, and P < .00001 of Wilcoxon rank sum test is indicated by *, **, and ***, respectively. Error bars show the standard deviation.
Measured volumetric group mean ADC values ± standard deviation for mMGMT and uMGMT glioblastomaa
For both mMGMT and uMGMT GBMs, group mean ADC increased as a function of distance from TCtotal toward the periphery of the perienhancing FLAIR hyperintensity (Fig 4C, Table). Between PIZ1 and PIZ5, we measured a 12.4% (1298 ± 153 versus 1459 ± 131 × 10−6 mm2/s, P < 10−5) and 9.5% (1189 ± 124 versus 1302 ± 145 × 10−6 mm2/s, P < 10−5) increase for mMGMT and uMGMT, respectively.
In the closest neighboring PIZ subvolume around the TCtotal (PIZ1), we measured 9.1% (1298 ± 153 versus 1189 ± 124 × 10−6 mm2/s, P < 10−4) higher ADC in mMGMT than in uMGMT (Fig 4C, Table). This difference between mMGMT and uMGMT and the degree of its statistical significance was at 5 voxel distance from the periphery of TCtotal even higher. We measured 12.1% (1459 ± 131 versus 1302 ± 145 × 10−6 mm2/s, P < 10−8) higher ADC in PIZ5 of mMGMT than uMGMT (Fig 4C, Table).
Similarly to ADC, for both mMGMT and uMGMT GBMs, group mean ADClow increased as a function of distance from TCtotal toward the periphery of the FLAIR hyperintensity (Table, Online Supplemental Data). Between PIZ1 and PIZ5, we measured a 14.1% (888 ± 118 versus 1013 ± 87 × 10−6 mm2/s, P < 10−5) and 7.6% (837 ± 99 versus 901 ± 92 × 10−6 mm2/s, P < 10−5) ADClow increase for mMGMT and uMGMT, respectively. Similarly to ADC, this distance-resolved ADClow increase around the TCtotal was significantly different for the 2 subgroups. From PIZ2, we measured significantly higher ADClow values in mMGMT than in uMGMT tumors, as illustrated in the Online Supplemental Data. The evaluation of ADChigh, which shows a similar trend to ADC and ADClow, can be found in the Online Supplemental Data.
Figure 5 shows the ROC analysis. The classification based on a single threshold value of ADC =1328.5 × 10−6 mm2/s determined for PIZtotal (Table) yielded an AUC of 0.59 with a sensitivity of 62% and a specificity of 55%. In contrast, by using the distance-resolved group mean ADC values and majority voting of the 5 PIZ subvolumes, we calculated an AUC of 0.75 with a sensitivity of 70% and a specificity of 80% (ADC threshold value was 1221.5, 1295, 1351.5, 1384.5, and 1393.5 × 10−6 mm2/s for PIZ1, PIZ2, PIZ3, PIZ4 and PIZ5, respectively, Table).

Receiver operating characteristic curves of predictors by using the determined group mean ADC values in the PIZ as the threshold for differentiation of mMGMT from uMGMT. The thresholds were determined as group mean ADC value of mMGMT in the 3D segment minus 50% of the SD: threshold = mean (ADCmMGMT) – (SD ×0.5). PIZtotal (including all 5 PIZ subvolumes) used 1 single threshold of 1.431 – (205 × 0.5) = 1328.5 × 10−6mm2/s (Table). Tumors with mean ADC below 1328.5 × 10−6mm2/s for PIZtotal were classified as uMGMT. For MGMT prediction with distance-resolved ADC, the threshold was determined for each PIZ subvolume separately. Threshold was 1298 – (153 × 0.5) = 1221.5, 1369 – (148 × 0.5) = 1295, 1422 – (141 × 0.5) = 1351.5, 1451 – (133 × 0.5) = 1384.5, and 1459 – (131 × 0.5) = 1393.5 for PIZ1, PIZ2, PIZ3, PIZ4, and PIZ5, respectively (all in ×10−6 mm2/s, Table). MGMT status was determined by using majority voting of the PIZ subvolumes. AUC was 0.59 (red curve) and 0.75 (blue curve) for PIZtotal and for the distance-resolved prediction (PIZ1-5), respectively. Distance-resolved ADC thresholds resulted in higher classification accuracy than by using a single threshold for the entire PIZ.
The mean group volume of the 3D segments did not differ significantly between mMGMT and uMGMT tumors (Fig 4A). Patient age or sex did not correlate with the measured volume sizes or ADC values (results not shown). Measured values are tabulated in Table and shown with boxplots in Fig 4 and the Online Supplemental Data.
DISCUSSION
We report a 3D volumetric and distance-resolved evaluation of preoperative ADC in the PIZ of GBM. This novel method reveals marked differences in the subvolumes of PE around the TC. We measured a significant increase of group mean ADC as a function of distance from TC toward the periphery of the FLAIR hyperintensity, a probable indication of tissue alteration due to tumor infiltration. Interestingly, while group mean ADC of TCtotal showed no differences between mMGMT and uMGMT, the distance-resolved 3D analysis revealed a significant difference in the ADC profile around the TCtotal, a probable indication of differences in tissue composition in this area.
In contrast to the tumor core (TCtotal), which contains mainly solid tumor tissue and necrosis, which are mostly removed by surgery, the PE is a mixture of brain parenchyma and infiltrating tumor cells and represents the main site of tumor progression.15⇓-17,20 Therefore, the PE is an area of interest for GBM treatment as the differentiation between pure edema and the PIZ is crucial to define resection margins and target volumes for radiation therapy. However, to date, preoperative characterization of the PIZ in GBM remains challenging. In this study, a 5-voxel wide adjacent volume of PE around the TC was the focus (Figs 2 and 3), as this tissue is directly affected by infiltrative growth, with radiologic changes due to invasion and edema, and is the main target for both radiation therapy and possible recurrence.
We found a significant ADC increase from the neighboring to the peripheral PIZ regions in both groups (Fig 4C and Online Supplemental Data) that was imperceptible to the human eye in the images. Auer et al42 and Blystad et al43 analyzed the PE in 2D with quantitative T1 and T2 relaxometry. They found a gradient of relaxation values from TCtotal toward the PE periphery that was also not visually apparent on the images. PE is mainly caused by tumor infiltration that involves vascularization, micronecrosis, angiogenesis, cell proliferation, and apoptosis, effects that are higher in the proximity of TCtotal than at greater distance from it.15,20 The increase of ADC from PIZ1 toward PIZ5 might be accountable for changes in extracellular matrix composition due to invasive growth as GBM always shows an infiltrative growth and tumor cell migration from the inside out.15,20
Several studies have quantitatively investigated the correlation between ADC and MGMT status and overall survival rate, with varying results. Romano et al40 used the lowest 15th percentile of ADC values within the TC and reported significantly higher minimum ADC values in mMGMT than in uMGMT tumors. Similarly, Moon et al23 reported that ADC was significantly higher in the TC of mMGMT. In contrast, Pope et al30 reported lower ADC in TC of mMGMT than in uMGMT. Ladenhauf et al39 found significantly lower group mean ADC in the PIZ of mMGMT than in uMGTM, while these colleagues did not measure any difference in TCtotal. We hypothesize that the reason for the conflicting results is at least partly due to the single slice evaluation used in 2D that can significantly influence the analysis as GBM is characterized by heterogeneous tumor tissue.
Using volumetric 3D evaluation, we did not measure any significant difference between mMGMT and uMGMT tumors for the TCtotal or TC volume regardless of whether we used ADC, ADClow, or ADChigh (Fig 4B, Online Supplemental Data). This finding is in agreement with Ladenhauf et al39 and indicates that ADC tissue structure of the tumor core is not significantly different between the 2 GBM subgroups, resulting in similar mean ADC values. In contrast, ADC in PIZ of mMGMT was significantly higher than in the uMGMT subgroup (Fig 4B, Online Supplemental Data), indicating that the underlying tissue structure may differ between these 2 groups. This assumption is further supported by our distance-resolved analysis, which further highlights the difference between the PIZ of mMGMT and uMGMT. The approximately 12% difference in distance-resolved ADC increase in the PIZ between mMGMT and uMGMT tumors (Fig 4C, Online Supplemental Data) strongly suggests the presence of differences in tissue characteristics. We speculate that the measured ADC difference is due to differences in tumor cell attenuation and/or extracellular matrix degradation through tumor infiltration. In the only other publication focusing on the PIZ and ADC differentiation of MGMT, Ladenhauf et al found significantly lower ADC in mMGMT GBM39 by using 2D analysis. Furthermore, based purely on visual analysis, Ellingson et al51 found more pronounced PE in uMGMT compared with mMGMT. Our findings, at least in the PIZ, suggest the opposite, ie, less edema-component and higher cellularity in uMGMT compared with mMGMT.
MGMT status classification based on distance-resolved ADC thresholds and majority voting from the PIZ subvolumes yielded an accuracy of 75%, which we found acceptable considering that classification was based on thresholds determined by using a simple statistical approach. We hypothesize that a sophisticated deep-learning approach could reach a higher accuracy. Nevertheless, the ROC analysis further highlights the difference between the PIZ of mMGMT and uMGMT and indicates that the prediction of the MGMT status by using MRI is feasible. In addition, for our cohort group, the distance-resolved subdivision of the PIZ into smaller subvolumes (from PIZ1 to PIZ5 with 1 voxel increment) and corresponding distance-resolved statistical analysis and ROC evaluation depicted ADC characteristics that were hidden in a larger volume such as the PIZtotal. This underlines the importance of distance-resolved evaluation of the PIZ, which may further increase the sensitivity of the analysis.
Although we obtained encouraging results, our study has some limitations, including its retrospective nature and single-center cohort group. Furthermore, we could not correlate ADC with neuropathologic and molecular data, eg, cell attenuation, pleomorphism, molecular signature in the PIZ, and explain our findings in the context of tissue characteristics, although this is a general problem of in vivo imaging research. To our knowledge, with current histologic methods, it is impossible to harvest and analyze tissue samples of the PIZ with similar distance resolution as the one used here. Nevertheless, in the future, it would be of great interest to correlate distance-resolved quantitative MRI values in the PIZ with corresponding histologic analysis.
CONCLUSIONS
We presented here 3D volumetric evaluation of preoperative ADC in GBM that revealed volumetric tissue signatures imperceptible to the human eye on conventional MRI. We combined state-of-the-art 3D GBM segmentation with a novel distance-resolved analysis of the PIZ and analyzed volumetric mean ADC in 2 GBM subgroups: mMGMT versus uMGMT. Using our novel method, we demonstrated that mean ADC values around the tumor core significantly increase as function of distance from TC toward the periphery of the perienhancing FLAIR hyperintensity. While group mean ADC of TCtotal or TC showed no significant difference between mMGMT and uMGMT, distance-resolved 3D analysis of PIZ revealed a significant difference in ADC profile around the tumor core, indicating epigenetically influenced differences in perienhancing tissue characteristics between mMGMT and uMGMT GBM. The method presented here has the potential to provide a precise characterization of GBM tissue in the perienhancing region and could be applied to a number of other unresolved clinical challenges such as distinguishing between tumor infiltration and pure edema.
Footnotes
Disclosure forms provided by the authors are available with the full text and PDF of this article at www.ajnr.org.
References
- Received June 2, 2024.
- Accepted after revision August 2, 2024.
- © 2025 by American Journal of Neuroradiology


Jump to section
Related Articles
Cited By...
- No citing articles found.