
Graphical Abstract

Abstract
BACKGROUND AND PURPOSE: Sturge-Weber syndrome (SWS) is a rare congenital disorder characterized by cortical atrophy and calcifications on late-stage imaging. Understanding the evolution of brain lesions is crucial for effective early interventions, yet the timeline remains unclear. We aimed to evaluate early brain MRI findings and their progression longitudinally on follow-up MRI in children diagnosed with SWS.
MATERIALS AND METHODS: We retrospectively included all children with a confirmed diagnosis of SWS between 2009 and 2023 who had at least 2 available MRIs performed before the age of 2 years. A pediatric radiologist and a pediatric neuroradiologist evaluated all the MRI scans for pial enhancement, choroid plexus enlargement, atrophy, calcifications, a prominent subarachnoid varicose network, transmedullary veins, subependymal veins, and deep extraventricular veins. Descriptive analysis was used for demographic data and brain lesion prevalence. Cumulative incidence curves were used to show the timeline of emerging lesions. K-means clustering was used to categorize the lesions based on their prevalence at 1, 2, 3, 6, 12, 18, and 24 months after birth.
RESULTS: Nine patients met the inclusion criteria. Median ages at the first and last MRIs were 35 days (interquartile range [IQR]: 11–123) and 294 days (IQR: 208–465), respectively. The most prevalent lesions at the first MRI were subarachnoid varicose network (88.9%) and transmedullary veins (77.8%), while prevalence of atrophy and calcifications differed most between the first and last MRIs. The results of the elbow method and K-means clustering showed that we can divide SWS lesions into 3 groups based on their timeline of emergence. The first cluster contained subarachnoid varicose network, transmedullary veins, subependymal veins, and choroid plexus enlargement. The second cluster contained deep extraventricular veins, pial enhancement, accelerated myelination, and atrophy. The last cluster contained calcifications.
CONCLUSIONS: Our findings suggest that dilated venous channels emerge early as a compensatory mechanism, preceding atrophy and calcification. Additionally, these dilated channels precede the appearance of abnormal contrast enhancement of the pia, often termed leptomeningeal angioma. This underscores the importance of early recognition and monitoring of these initial imaging indicators in clinical practice.
ABBREVIATIONS:
- ASL
- arterial spin-labeled
- IQR
- interquartile range
- MinIP
- minimum intensity projection
- SWS
- Sturge-Weber syndrome
SUMMARY
PREVIOUS LITERATURE:
In Sturge-Weber syndrome, abnormal cortical venous drainage results in deep venous collaterals. Failure of compensatory venous drainage causes venous congestion, hypoperfusion, chronic anoxia, neuronal gliosis with eventual atrophy, and cortical calcification. Traditionally, pial enhancement is the key diagnostic imaging sign of SWS, the so-called pial angioma. In addition to enhancement of the pia, a network of varying-sized venous structures with flow voids is seen separately in the subarachnoid space.
KEY FINDINGS:
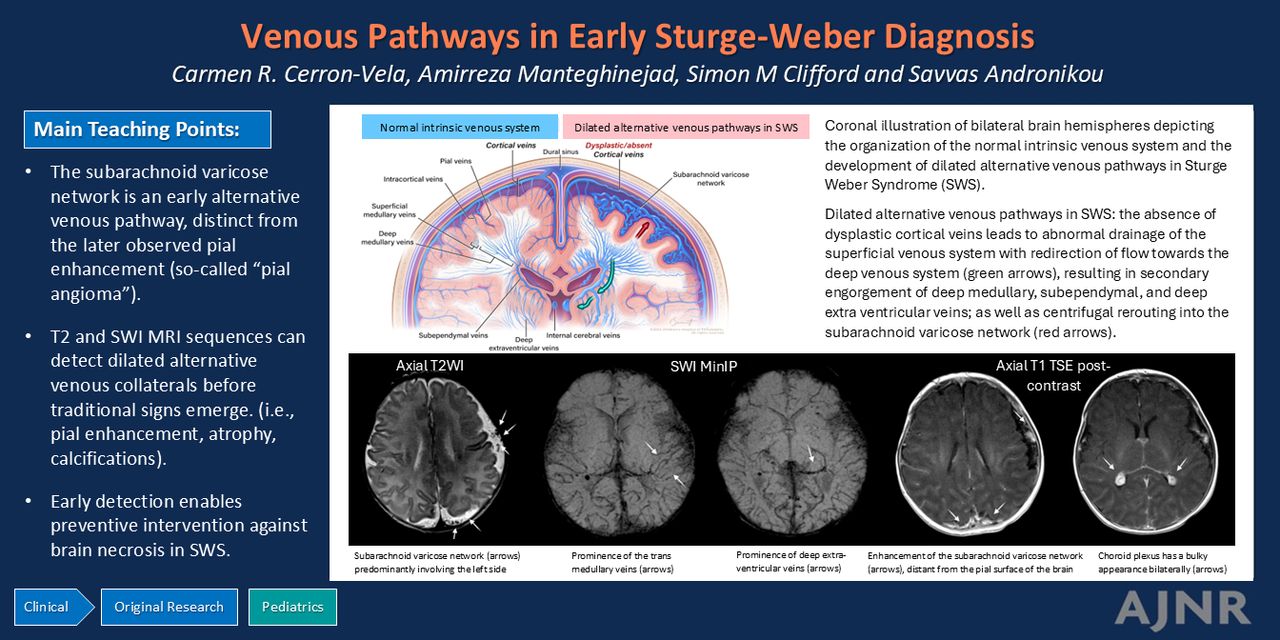
Pial enhancement itself is not as frequently present in the very early stages of SWS (although it can be seen within the first 2 months), and is preceded by the appearance of centripetal venous drainage compensatory pathways and the subarachnoid varicose network, likely a centrifugal alternative pathway.
KNOWLEDGE ADVANCEMENT:
For children with high-risk port-wine stain, early imaging, before 3 months of age, should include T2 and minimum intensity projection SWI sequences to identify alternative venous pathways. This includes detection of the subarachnoid varicose network, seen separate from pial enhancement, visualized without and with contrast enhancement.
Sturge-Weber syndrome (SWS) is a rare congenital disorder characterized by cutaneous, neurologic, and ocular manifestations due to capillary-venous malformations in the skin, brain, and eye, caused by a somatic mutation (p.Arg183Gln, p.R183Q) in the guanine nucleotide-binding protein G(q) subunit α (GNAQ) gene. In the brain, SWS is characterized by the development of what has been termed, even recently, as a leptomeningeal or pial angioma, leading to chronic brain injury.1
Abnormal cortical venous drainage and abnormal deep venous collaterals are implicated in the pathophysiology of intracranial abnormalities in patients with SWS.2 These abnormalities lead to cerebral parenchymal venous congestion, later resulting in hypoperfusion, chronic anoxia, neuronal gliosis, atrophy, and cortical calcifications,3 the imaging corollary of which has recently been demonstrated by using perfusion (arterial spin-labeled [ASL]) MRI.4 SWS therefore presents as an evolution of imaging findings that may include abnormal venous structures, development and evolution of venous compensatory pathways, signs of venous congestion, hypoperfusion, and parenchymal necrosis with eventual development of the classic SWS features of atrophy and calcification.
Most patients with brain involvement will begin seizure activity by 2 years of age,5 which is a landmark in the progression of SWS. The so-called presymptomatic phase constitutes a critical time window for treatment or intervention that may delay or even avoid seizures with subsequent improvement of neurologic outcomes.6 Although some studies have investigated early MRI features to diagnose brain involvement in the presymptomatic phase,7⇓⇓–10 SWS disease progression, and therefore, the progression of imaging findings remain unclear.
Many authors agree that when screening infants with high-risk SWS, negative MRI cannot be considered conclusive if performed early. Still, there is no consensus regarding who to screen or the age at which a negative scan can reliably exclude SWS.11,12 We aimed to evaluate the evolution of brain changes in children with SWS on brain MRI that occur before 2 years of age and establish a possible timeline of venous and parenchymal changes that may guide the early assessment and management of these patients.
MATERIALS AND METHODS
We conducted a single-center, retrospective study in a large tertiary pediatric hospital. Our study was reviewed and approved by our institutional review board and complied with the Health Insurance Portability and Accountability Act. We obtained a waiver for documentation of informed consent.
From our clinical radiology database, we retrospectively identified all patients with suspected clinical diagnoses of SWS, later confirmed with imaging, between 2009 and 2023 by using mPower (Nuance Communications) and Illuminate (InSight). We obtained demographic and clinical data from an electronic chart system (Epic Systems). The inclusion criteria were as follows: patients with a confirmed clinical diagnosis of SWS with at least 2 available MRIs before the age of 2 with a gap of at least 2 months between scans (Online Supplemental Data).
Imaging Data Acquisition
All patients underwent either 1.5T or 3T brain MRI (Siemens Medical Solutions). Slice thickness varied from 2 to 4 mm with an interslice gap from 0 to 3 mm. Sequences performed included at minimum T1WI, T2WI, T2-FLAIR, and gadolinium-enhanced T1WI TSE. Depending on the scanner, SWI and ASL perfusion sequences were also available on most MRI scans.
Image Analysis
All imaging was retrospectively reviewed in consensus by a pediatric radiologist (with 4 years of experience) and a pediatric neuroradiologist (with more than 20 years of experience). The following parameters were recorded (according to MR sequence):
T2WI
- Brain hemisphere involvement (unilateral, bilateral)
- Cortical atrophy
- Venous abnormalities (including choroid plexus thickening)
- Myelination changes
Minimum intensity projection (MinIP) SWI
- Venous abnormalities
- Presence of calcifications
Gadolinium-enhanced T1WI TSE
- Pial enhancement
ASL
- Perfusion
Vein abnormalities were categorized based on their anatomic distribution into the following3,13⇓–15 (Fig 1).

Coronal illustration of bilateral brain hemispheres depicting the organization of the normal intrinsic venous system and the development of dilated alternative venous pathways in SWS. Normal intrinsic venous system: The superficial cerebral venous system comprises cortical veins, superficial medullary veins, and smaller vessels such as intracortical veins and pial veins. These vessels ultimately drain into the dural venous sinuses. The deep cerebral venous system consists of the deep medullary veins, which converge towards the ventricles and merge with the subependymal veins, eventually draining into the internal cerebral veins. Other veins contributing to the internal cerebral veins are referred to as deep extraventricular veins. The paired internal cerebral veins later drain into the vein of Galen. Dilated alternative venous pathways in SWS: In areas of the brain affected by SWS, the absence or dysplastic cortical veins leads to abnormal drainage of the superficial venous system with redirection of flow toward the deep venous system (green arrows), resulting in secondary engorgement of deep medullary veins, subependymal veins, and deep extraventricular veins, as well as centrifugal rerouting into the subarachnoid varicose network (red arrows).
Subarachnoid Varicose Network.
We developed this term to describe what has previously been (likely erroneously) termed a leptomeningeal or pial angioma, which has been used to describe the engorged pial vessels with corresponding thickening of the leptomeninges and postcontrast enhancement, secondary to the abnormal cortical venous drainage.3,16,17 The subarachnoid varicose network represents an engorged venous plexus over the cerebral surface that is hypothesized to drain through developmental venous anomalylike channels and hypertrophy of a small group of remnant transcerebral veins toward the subependymal vessels only, without any superficial drainage.3,14 We defined the subarachnoid varicose network as a group of dilated/ectatic vessels (venous plexus) located in the subarachnoid space that develops as collateral venous drainage channels (alternative venous pathway) secondary to a centrifugal rerouting of an overloaded deep cerebral venous drainage.
Transmedullary Veins.
Composed of the deep medullary veins, these are responsible for the deep drainage of the white matter as they traverse the white matter to connect with subependymal veins.
Subependymal Veins or Periventricular Veins.
These veins receive blood from the deep medullary veins and subsequently drain into the larger internal cerebral veins.
Deep Extraventricular Veins.
These are vein tributaries to the internal cerebral veins, including the direct lateral and medial atrial veins, and tributaries to the basal vein of Rosenthal, including the deep middle cerebral vein and inferior ventricular vein, which eventually join the vein of Galen and then drain to the straight sinus.15
Data Analysis
We used descriptive statistics for demographics. The prevalence of brain lesions was presented as frequencies and percentages. A spider plot was also used to show the prevalence of brain lesions at the first and last MRIs. To show the trend of developing lesions, cumulative incidence curves were used. Log-rank tests were used to compare the trends of developing lesions. Finally, we used K-means clustering to categorize brain lesions based on their time of development. To achieve this, we generated variables representing the prevalence of each lesion at specific time points: 1 month, 2 months, 3 months, 6 months, 12 months, 18 months, and 24 months after birth. We also used the elbow method to find the optimum number of clusters.
SPSS Statistics (Version 29.0; IBM) and scikit-learn (Version 0.23.2)18 library were used to analyze the data. A P value < .05 was used to indicate statistical significance. Plots were created by using Seaborn (Version 0.11.2) and Matplotlib (Version 3.5.2) libraries in Python.
RESULTS
Nine children, comprising 5 (56%) boys and 4 (44%) girls, formed part of this study based on the inclusion and exclusion criteria. Five (56%) children had 2 MRIs before the age of 24 months, while the other 4 (44%) had 3 MRIs. The median age at the time of the first MRI was 35 (interquartile range [IQR]: 11–123) days and at the last MRI was 294 (IQR: 208–465) days.
The most common brain findings overall throughout the whole cohort were prominent deep extraventricular veins, pial enhancement, and atrophy, which were seen in all the patients.
Comparing the first and last MRIs, findings of a prominent subarachnoid varicose network and transmedullary veins had the highest prevalence (88.9% and 77.8%, respectively) at the time of the first MRI, while atrophy and calcifications had the highest prevalence difference between the first and last MRI. Fig 2 demonstrates the prevalence of each finding in the first and last MRIs. Detailed individual patient MRI findings are summarized in the Online Supplemental Data.

Spider (radar) plot showing the prevalence of brain lesions from baseline MRI (blue) to the last brain MRI (red). Each spoke represents a lesion prevalence. The distance from the center to a point on a spoke indicates the prevalence percentage for that category.
The cumulative incidence curves in Fig 3 show the timelines of visualization of the subarachnoid varicose network, transmedullary veins, subependymal veins, and deep extraventricular veins against pial enhancement in the first 2 months of life and against calcifications in the first 24 months of life. During the first 2 months, although the difference was not significant, the subarachnoid varicose network, transmedullary veins, subependymal veins, and deep extraventricular veins tended to appear earlier than pial enhancement. During the first 24 months, there is a significant difference in the timing of visualization of subarachnoid varicose network with the appearance of calcifications (P < .001), noting that calcifications occur later in the progression of the disease.

A, Cumulative incidence curves comparing the timeline of involvement of cerebral venous structures based on the age of patients (days) in the first 60 days. B, Cumulative incidence curves comparing the timeline of calcifications, pial enhancement, and subarachnoid varicose network in the first 2 years.
The Online Supplemental Data show the elbow plot for finding the best number of clusters, from which we chose to have 3 clusters. The results of K-means clustering showed that the first cluster contained subarachnoid varicose network, transmedullary veins, subependymal veins, and choroid plexus enlargement. The second cluster contained deep extraventricular veins, pial enhancement, accelerated myelination, and atrophy. Finally, the last cluster contained calcifications.
DISCUSSION
In this study, we evaluated early brain MRI findings in a series of 9 patients with the diagnosis of SWS from imaging performed while the patients were younger than 2 years of age and demonstrated important differences in the timing of the appearance of different imaging findings.
In SWS, the classically described imaging findings by using MRI or CT are superficial cerebral calcification, atrophy, and leptomeningeal enhancement.19 However, our findings show that these observations do not manifest in the early phases of the disease and represent eventual outcomes of overburdened compensatory mechanisms resulting in cortical and subcortical necrosis. Compensatory mechanisms ultimately falter due to advancing venous stasis, abnormal drainage, and concomitant compromised arterial blood flow to the underlying brain.4,12,20 The cumulative incidence curves (Fig 3) we created from our data demonstrate this as a notable disparity in the timeline of the appearance of vein abnormalities and the onset of calcifications.
The absence of cortical veins in SWS with resultant centripetal venous drainage into enlarged medullary veins or anomalous deep veins in SWS has been described previously.19,21,22 It has been proposed that in SWS, the anomalous venous plexus over the cerebral surface (subarachnoid varicose network) results in abnormal cortical drainage, progressive venous stasis, and chronic hypoxia with secondary enlargement of trans medullary venous collaterals redirecting flow toward the deep venous system.16 It has also been proposed that over time, the subarachnoid varicose network is exacerbated by progressive overburdening and possible occlusion of deep veins, with the resultant centrifugal rerouting of deep cerebral venous drainage into the already overburdened anomalous surface venous plexus.23 In this latter context, the subarachnoid varicose network represents dilated venous channels in the subarachnoid space attempting to divert venous blood away from the cortex toward the venous sinuses—a collateral pathway. Both scenarios explain why the subarachnoid varicose network is present at the early stages of the disease, around the same time as various other dilated alternative drainage pathways that have been described in this study (Fig 3 and Fig 4).

Eleven-day-old boy presenting with facial and chest port-wine stain. A–E, Initial MRI at 11 days of age showed extensive bilateral cerebral hemispheric involvement with the following signs. A, Axial T2WI: subarachnoid varicose network (arrows) predominantly involving the left side. B and C, Axial SWI MinIP shows prominence of the transmedullary veins (arrows in B) and deep extraventricular veins (arrow in C) on the left. D and E, Axial T1 TSE postcontrast shows enhancement of the subarachnoid varicose network (arrows in D), distant from the pial surface of the brain, which is not enhancing. The choroid plexus has a bulky appearance bilaterally (arrows in E). F, At 5 months of age, a CT was performed because of the onset of seizures. Axial noncontrast CT shows interval development of calcifications (arrow). G–J, Follow-up at 7 months of age demonstrates interval progression of brain involvement (atrophy) predominately on the left side. G, Axial T2WI shows interval progression of the subarachnoid varicose network (white arrows) and cortical atrophy (black arrows). H, Axial SWI MinIP shows progression of transmedullary veins (arrows) and subependymal veins (large dashed arrows). I, Axial T1 TSE postcontrast shows the interval development of bilateral abnormal pial enhancement coating the surface of the brain with outlining of the sulci and extending to the left frontal lobe (arrow). J, ASL showing decreased perfusion on the left side, corresponding to the region of abnormal pial enhancement (arrows).
Even though classic embryology does not completely explain the formation of the subarachnoid varicose network (also known as pial angioma) in SWS,14 it is suggested that it results from failure of the primitive cerebral venous plexus to regress and properly mature at 4 to 8 weeks of gestation, when deep medullary veins should become disconnected from the surface network.20,23 A nonthrombotic venoclusive process has been suggested as an underlying mechanism, which commences in utero and progresses postnatally.21,23 It is therefore understandable that brain changes have been reported as early as the prenatal period.24 This would also account for why certain patients exhibit overwhelmed compensation mechanisms as early as during the neonatal period (Fig 5).

Seven-week-old girl born at 26 weeks’ gestation showing clinically an erythematous rash on the right side of the face, left forehead, and right upper chest. A and B, Initial MRI at 7 months of age. A, Axial T2WI shows atrophy of the right cerebral hemisphere with decreased T2 signal in the white matter ipsilaterally, in keeping with accelerated myelination (long arrows). Note the subarachnoid varicose network outlined by CSF, best seen posteriorly over the right parietal lobe (short arrows). B, Axial postcontrast T1 TSE shows abnormal pial enhancement on the right, outlining the sulci (long arrows), as well as enlargement of the ipsilateral choroid plexus (short arrow). C–E, Follow-up at 3 months. C, Axial T2WI shows the subarachnoid varicose network posteriorly to be more prominent (short arrows), as well as ongoing brain atrophy and signs of accelerated myelination (long arrows). D and E, Axial SWI MinIP shows paucity of cortical veins on the right side as compared to the left, while there is prominence of the subependymal veins (arrows in E). F–H, Follow-up at 10 months of age. F, Axial T2WI shows severe progression of right hemispheric atrophy. G, SWI MinIP shows coarse susceptibility artifacts involving the right frontal and parietal lobe in keeping with calcifications (arrows). H, ASL shows areas of decreased perfusion in the right hemisphere (arrows).
It has been suggested that mutations occurring early in fetal development likely affect the brain, skin, and eyes, leading to the full spectrum of SWS.25 Global expression of p.R183Q GNAQ early during development is incompatible with survival,26 while mutations occurring later in fetal life may have a limited impact and manifest as isolated port-wine stain.25 According to the Roach classification, SWS has three types: Type I features both facial and leptomeningeal angiomas and may involve glaucoma; Type II has facial angiomas alone, also potentially with glaucoma; and Type III presents with isolated leptomeningeal angiomas, usually without glaucoma.27 Based on this classification our cases fall into the type I category (if our intracranial findings are considered as equivalent of what is termed a leptomeningeal angioma). Additionally, all of our patients presented with high-risk port-wine stains (Online Supplemental Data). Hemifacial, forehead, and median port-wine stain phenotypes involve skin originating from the frontonasal placode, which shares common progenitor cells with the brain28,29; the severity of SWS is significantly higher with these phenotypes.11 Bilaterality, V1 distribution, and extensive port-wine stain with V2 and V3 involvement of the trigeminal nerve also contribute to the risk of SWS.30,31 Many authors have recommended early MRI scans (before 3 months of age) in patients presenting with these clinical features.29,31,32
We have shown a variety of venous abnormalities representing dilated alternative drainage pathways to counter venous hypertension, which builds over time as the result of the abnormal cortical venous drainage.3,21 Using the K-means clustering, we have shown by using early MRI scans in our cohort, that the presence of a prominent subarachnoid varicose network, along with enlargement of transmedullary veins, subependymal veins, and enlargement of the choroid plexus, precedes the enlargement of deep extraventricular veins, myelination changes, pial enhancement, atrophy, and calcifications (Online Supplemental Data). Similar to our study, Juhász et al2 described that the alternative collateral drainage for venous blood toward the deep cerebral venous system becomes increasingly prominent, presumably as the cortical veins occlude progressively. This explains why compensatory vein dilation is depicted first. Other studies have also demonstrated the evolution of compensatory venous pathways in SWS by using routine MR sequences.4,22 Some authors have also described increased thickness of the choroid plexus as a sensitive and specific sign to support the early diagnosis of SWS, when contrast MRI is not available or does not as yet show pial enhancement.25 Under the same pathophysiology, ineffective venous drainage leads to choroid plexus engorgement, supported by the frequent observation of engorged ependymal veins (centripetal venous drainage).33
Understanding the primary issue—failure to develop cortical veins for proper drainage and subsequent venous hypertension—helps explain why choroid plexus enlargement is a radiologic sign of venous congestion from poor venous drainage. This same underlying pathophysiology also accounts for the engorgement of the subarachnoid varicose network, which likely results from the centrifugal rerouting of deep cerebral venous drainage.
In this study, we purposefully distinguished the presence of engorged vascular structures within the subarachnoid space from abnormal postcontrast enhancement of the pia mater, and although not statistically significant (likely due to small number of cases), this revealed noteworthy differences. The subarachnoid varicose network was identified as early as 5 days of age, with other alternative venous pathways being detected by 11 days of age. In contrast, pial enhancement was observed earliest at 35 days of life.
The presence of leptomeningeal or pial enhancement has traditionally been considered an essential diagnostic imaging sign of SWS7,12 and has been considered the radiologic representation of the so-called pial angioma. However, in a recent study, Venkatakrishna et al34 evaluated histopathology specimens of 5 patients with SWS who underwent surgery, and demonstrated that the subarachnoid varicose network is not a thickening or abnormality of the pia mater itself, but is observed separately within the subarachnoid space as a network of varying-sized venous structures with flow voids. These were presumed to represent an alternative venous drainage pathway to compensate for the maldevelopment of cortical veins, which is the primary abnormality in SWS.
Although pial enhancement has been reported as an early sign seen in the diagnosis of presymptomatic patients younger than 3 months of age,12 we found that pial enhancement itself is not as frequently present in the very early stages and although it can be seen within the first 2 months, it is preceded by the appearance of various venous drainage compensatory pathways, primarily the subarachnoid varicose network, which is frequently present. Venous drainage compensatory pathways were identified by using a MinIP SWI sequence, because of its sensitivity for venous structures, and on T2-weighted imaging, in which the subarachnoid varicose network stands out as flow voids (dark) against the background subarachnoid CSF (bright).22
We also demonstrated that postcontrast enhancement of the subarachnoid varicose network is independent from the postcontrast enhancement of the pia mater, with the latter occurring later in the disease progression. In this way, we determined that the alternative venous drainage pathways preceded that of the typical pial enhancement, both of which are seen with contrast-enhanced spin-echo T1 and contrast-enhanced 3D MPRAGE.12,16
There is also increasing evidence that suggests leptomeningeal or pial-arachnoid enhancement is linked to cortical gray matter tissue loss rather than an angioma.35 Given that gray matter tissue loss develops gradually over time in these patients, it is understandable why atrophy and any pial or pial-arachnoid enhancement related to this atrophy may not be reliable early diagnostic features for SWS. Likewise, hypermyelination has been associated with transient hyperperfusion and hypermetabolism in the affected area, believed to be a response to stress (hypoxia),20 thus typically manifesting as a consequent/subsequent finding.
Similar to other researchers29,32 we advocate for protocols that incorporate early imaging before 3 months of age for patients with high-risk port-wine stains. We suggest including at least T2 and MinIP SWI sequences, to identify the alternative venous pathways as an early sign of brain involvement in SWS, particularly recognizing the subarachnoid varicose network as a different entity from pial enhancement, the former of which can be visualized even without postcontrast enhancement.
Potential benefit of presymptomatic antiepileptic treatment combined with aspirin has been proposed,36 but no prospective studies have been completed. Some children with high risk for seizures may benefit from presymptomatic treatment, for example when bilateral SWS is suspected in the presence of extensive bilateral port-wine stains.37 Although the use of aspirin in this small series did not prevent seizures, the mortality rate in these patients is 0, and seizures have been controlled medically in most (Online Supplemental Data). Other studies acknowledge the role of the endothelial Gαq-R183Q gene and specific antiangiogenic therapies (including anti-PI3K or MAPK) for further research and drug development particularly in the management of port-wine stains.38,39 However, these have not been evaluated in the prevention of cerebral injury and seizures.
Our study has several limitations. The number of patients was limited by the low prevalence of the disease and the strict inclusion criteria of having at least 2 available MRIs before the age of 2 with a gap of at least 2 months between scans.
The lack of universal consensus on the appropriate age for conducting MRI surveillance in children with SWS presented a challenge for the retrospective collection of data with regard to age at which scanning was performed. K-means clustering relies on the number of patients and the variables provided, and our sample was limited to 9 patients, underscoring the need for a multi-institutional study. When dealing with small sample sizes, obtaining reliable clustering results can be challenging and result in unstable clustering outcomes, poor results, and low efficiency.40 The main idea of this analysis in our paper was to show how clustering analysis can help in studying this evolving disease and provide a template for evaluating larger patient cohorts. Additionally, our clustering analysis only used prevalence data at specific time points; adding more variables or changing the time points could potentially influence the results. To create the cumulative incidence curves, the start point is the day of birth, and we assumed that the prevalence of all lesions at birth is zero. However, given that SWS is a congenital condition, it is possible that these lesions may have been present during the fetal period, which can potentially influence the baseline prevalence. Additionally, determining the precise date of lesion emergence requires repeated MRIs, which is not feasible. As a result, in the cumulative incidence curve, if a patient had a lesion on an MRI, we took the date of the MRI as the initial day of lesion emergence. Last, a selection bias for the most severe patients with high-risk port-wine stains is unavoidable in this retrospective study as this disease is suspected on clinical grounds and imaging requests are triggered from these, with the most severe patients presenting at earlier ages.
CONCLUSIONS
Dilated venous channels develop early on as a compensation mechanism for absent or thrombosed cortical veins and predate the traditional findings associated with SWS, such as atrophy and calcification, which result later and reflect established brain necrosis. Dilated venous channels also predate the appearance of abnormal contrast enhancement of the pia, which has been previously referred to as a pial angioma. In this regard, we have demonstrated clear differences in timing between the appearance of a subarachnoid vascular network (seen on both T2 and with SWI) and the appearance of pial enhancement. MRI in children with SWS should be used to detect centripetal venous collateral pathways and centrifugal collateral pathways in the form of an engorged subarachnoid varicose network very early in postnatal life, early enough to allow for interventions to prevent brain necrosis.
Acknowledgments
The authors express their gratitude to Brittany Bennett, a board-certified medical illustrator from the Children’s Hospital of Philadelphia, whose exceptional graphic designs have greatly enhanced the visual representation of our research findings.
This study was approved by the Institutional Review Board of the Children’s Hospital of Philadelphia.
Footnotes
Disclosure forms provided by the authors are available with the full text and PDF of this article at www.ajnr.org.
References
- Received May 7, 2024.
- Accepted after revision July 23, 2024.
- © 2025 by American Journal of Neuroradiology


Jump to section
Related Articles
Cited By...
- No citing articles found.