Graphical Abstract

SUMMARY:
Conventional MRI is currently the preferred imaging technique for detection and evaluation of malignant spinal lesions. However, this technique is limited in its ability to assess tumor viability. Unlike conventional MRI, dynamic contrast-enhanced (DCE) MRI provides insight into the physiologic and hemodynamic characteristics of malignant spinal tumors and has been utilized in different types of spinal diseases. DCE has been shown to be especially useful in the cancer setting; specifically, DCE can discriminate between malignant and benign vertebral compression fractures as well as between atypical hemangiomas and metastases. DCE has also been shown to differentiate between different types of metastases. Furthermore, DCE can be useful in the assessment of radiation therapy for spinal metastases, including the prediction of tumor recurrence. This review considers data analysis methods utilized in prior studies of DCE-MRI data acquisition and clinical implications.
ABBREVIATIONS:
- AIF
- arterial input function
- AUC
- area under the curve
- DCE
- dynamic contrast-enhanced
- EES
- extravascular extracellular space
- HD-IGRT
- high-dose image-guided radiation therapy
- Kep
- exchange rate constant
- Ktrans
- permeability constant
- PD
- progressive disease
- SCI
- spinal cord injury
- SPGR
- spoiled gradient recalled
- TIC
- time intensity curve
- Ve
- extracellular volume fraction
- Vp
- plasma volume
The spine is the third most common location of metastasis and is the site at which 70% of osseous metastases are found.1,2 Early cancer diagnosis and subsequent treatment with a sharp eye on early detection of treatment failure are crucial for increased survival. Spinal osseous metastases are present in 5%-10% of all oncologic patients, with 10% of that subset having complications in the course of care.3,4 Approximately 20% of patients have their initial presentation of systemic malignancy as spinal cord compression.5
Conventional MRI is currently the preferred imaging technique for the detection and assessment of spinal metastases. Routine anatomic MR images of the spine typically include high spatial resolution, T1-precontrast, T2-precontrast, STIR-precontrast, and T1-postcontrast images. Conventional MRI does not provide information about a metastatic lesion’s hemodynamic characteristics; thus, it can be difficult to differentiate malignant from benign lesions or viable tumor from posttreatment change on conventional MRI alone.6
In contrast, dynamic contrast-enhanced (DCE) MRI is a noninvasive robust MR technique that provides additional information about a tumor’s physiologic and hemodynamic characteristics, which can serve as a surrogate marker for tumor viability, posttreatment response, and tumor discrimination. DCE-MRI is a well-established technique utilized to assess the aforementioned characteristics intracranially and is the standard of care at many institutions, especially for the discrimination of tumor viability and radiation necrosis.7
DCE-MRI assesses changes in the pharmacokinetics of an intravenously injected contrast agent as it disperses through a tumor’s vasculature, providing the means to evaluate tumor vascularity.8 Tumors contain abnormal neovasculature9⇓⇓-12 when compared with nonmalignant tissue, and it is this physiologic characteristic that DCE-MRI helps to evaluate for viable neoplasm. DCE-MRI essentially characterizes the microvascular environment and uncovers information about the tumor’s aggressiveness and the degree of angiogenesis.12 This review will describe the mechanism of DCE-MRI, the methods of analysis, and clinical applications including the appearance of healthy bone marrow and the ability of DCE-MRI to discriminate benign from malignant vertebral compression fractures, atypical hemangiomas from osseous metastatic disease, and hypervascular from hypovascular tumors. We will also describe the ability of DCE-MRI analysis to assess treatment efficacy and local recurrence and illustrate the reason DCE-MRI is an indispensable tool for oncologic spine imaging.
DCE-MRI Acquisition
DCE-MRI utilizes dynamic T1-weighted imaging during the bolus administration of a gadolinium-based contrast agent. Fast 3D T1-weighted spoiled gradient recalled echo (SPGR) sequence is the most widely used to acquire the DCE-MRI data. Typically, T1-weighted images are collected for several phases before contrast is injected (called “preinjection time period”). Subsequently, multiple phases are acquired over time (usually over a few minutes) during and after the arrival of the contrast into the tissue of interest.9,13 T1-weighted SPGR sequences can rapidly acquire data and provide adequate anatomic coverage and a high signal-to-noise ratio.14,15
Optimum sequence parameters should be considered to balance temporal resolution, spatial resolution, and scanning coverage. With the SPGR sequence, typical scanning parameters at 3T are as follows: TR of 4–5 ms, TE of 1–2 ms, slice thickness of 5 mm, flip angle of 20°, field of view of 32 cm, temporal resolution (Δt) of ∼5 seconds, and 10–12 images in the sagittal plane. A simulation study shows that optimal flip angle plays an important role in reducing noise on the concentration curves and effectively increases the precision of the kinetic parameter estimation.16 Low flip angles between 15 and 25 are generally used to improve the measurement of signal change due to contrast injection. Short TR and short TE should also be used to improve the scan time and to remove the T2* effect of contrast, respectively. Newer MRI scanners provide faster gradients (allowing shorter TRs) and a new 3D volume acquisition named differential subsampling with Cartesian ordering.17 This has been demonstrated to provide an effective temporal resolution of 3−4 seconds while preserving spatial resolution, allowing an extended number of phases without increasing scanning time compared with 3D SPGR acquisition. A power injector typically administers a bolus of gadolinium-based paramagnetic contrast agent at 0.1 mmol/kg body weight and a rate of 2–3 mL/s.
Pharmacokinetic Model and Analysis
DCE-MRI data can be analyzed by using quantitative or semiquantitative methods. Five different types of time intensity curve (TIC) patterns for contrast hemodynamics in tissue of interest have been described: type A (almost flat), type B (gradual rise in contrast enhancement), type C (fast wash-in then plateau), type D (fast wash-in then washout), and type E (fast wash-in then gradual rise in contrast enhancement).18 Tumors exhibit angiogenesis and demonstrate rapid wash-in of contrast into tissues and rapid washout.19 Semiquantitative analysis can produce descriptive parameters that characterize the shape and structure of a TIC. Descriptive parameters that can be directly obtained from the raw signal intensity data include wash-in enhancement slope, the area under the curve (AUC), maximum signal enhancement, peak enhancement, time to peak, maximum slope, and peak enhancement signal percentage change.20 However, semiquantitative analysis has several challenging aspects. Several parameters, like AUC and peak enhancement, do not necessarily have any physiologic correlates. In addition, those model-free parameters can be sensitive to variation between different acquisition protocols and noise.
The current consensus is that a 2-compartment pharmacokinetic model that evaluates the bidirectional exchange between the intravascular space (blood plasma) and extracellular extravascular space (EES) described by Toft and colleagues21 provides efficient means to obtain information regarding tumor vascularity when highly perfused tissue is assumed.22 This model is based on the assumption that contrast agents exist in 2 interchanging compartments, which are plasma and EES.23,24 The model utilizes the time course curve of contrast concentration to estimate perfusion, including permeability constant (Ktrans), exchange rate constant (Kep), plasma volume (Vp), and extracellular volume fraction (Ve). Ktrans is the transfer coefficient and a measure of vasculature leakiness, which estimates vessel permeability by assessing contrast leakage across the vascular endothelium from the blood plasma to the EES.25 Correspondingly, Kep (= Ktrans/Ve) estimates the reflux rate of the contrast agent from the EES back into blood plasma. Vp measures the total blood plasma volume, while Ve measures the total EES volume. Ktrans and Vp are especially favorable in tumor analysis, as they tend to display elevated values in viable neoplasms in relation to nonmalignant tissue.25,26
Arterial Input Function.
Because microvascular perfusion in a tissue is defined as the flow of contrast agent between the artery and tissue, determination of the arterial input function (AIF) is essential to quantify perfusion parameters in DCE-MRI. Quantitative analysis includes detection of AIF from the aorta within the imaging volume. Appropriate shape of the AIF curve should be selected based on pixels with a rapid increase in signal enhancement and sharp peak followed by minimal temporal noises.
Pixels with a large change in signal intensity, with a rapid change immediately after bolus injection, and with an early peak intensity are typically chosen for AIF. As interpatient variability of AIF exceeded intrapatient variability, utilization of individualized AIF is suggested.27 Additionally, manually delaying the aortic AIF by multiple phases can increase the accuracy of Vp assessments.28 Mechanistically, contrast takes longer to reach the cancer cells than the surrounding vasculature in spinal malignancies.
Obtaining AIF has several technical challenges, including 1) sub-mm (∼0.5 mm) in-plane spatial resolution to achieve accurate contrast kinetic characterization without partial volume effects of vessel wall, 2) sufficient anatomic coverage to cover the entire vasculature, and 3) high temporal resolution to capture the rapid increase of contrast dynamic in blood. For the spine, adequate arterial supply (from the aorta) can be captured in the sagittal plane.
Diagnostic Imaging Using DCE-MRI
DCE of Healthy Bone Marrow.
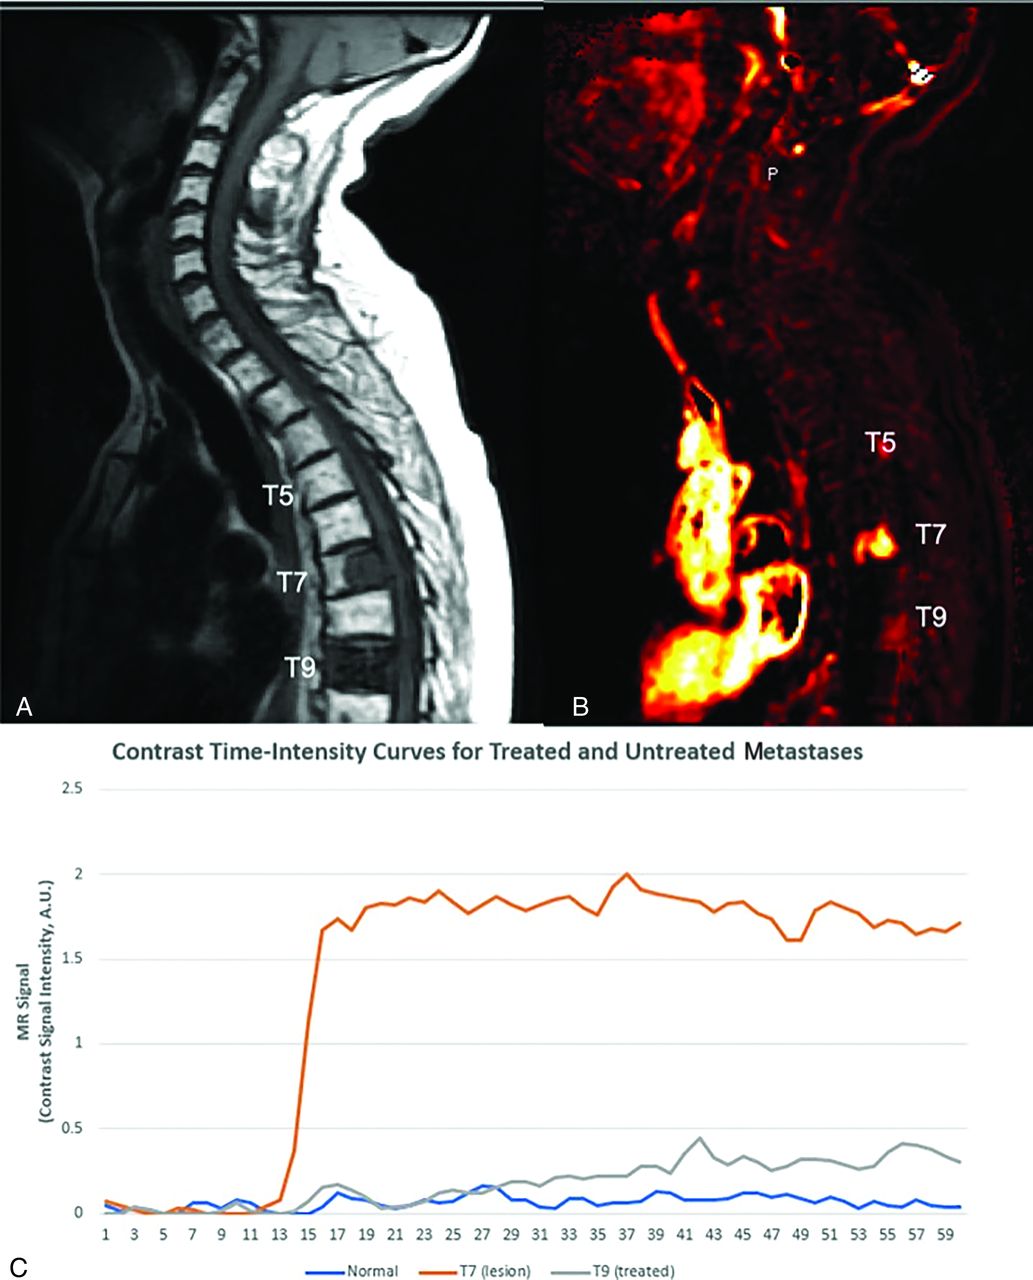
TICs generated after contrast enhancement can discriminate between benign normal-appearing marrow and malignant infiltrated marrow.29 Normal bone marrow shows little to no contrast uptake on TICs. Such low baseline perfusion, especially in mostly adipose tissue–replaced bone marrow in older individuals, makes the spine particularly attractive as a background for discriminating neoplastic lesions, which typically demonstrate increased perfusion parameters (Fig 1). Particularly, Vp has proved to be the leading parameter in discriminating between non-neoplastic tumors and malignant tumors.26

Graphic of normal marrow, viable tumor, and treated metastatic breast carcinoma. A, Sagittal T1 precontrast image demonstrates normal marrow signal at T5, posterior T7 metastasis, and diffuse metastatic involvement of T9. Based on the sagittal T1-precontrast (shown) and the T2 and postcontrast T1 images (not shown), it is not possible to distinguish between viable tumor and successfully treated metastasis. B, Perfusion imaging illustrates elevated plasma volume correlating to T7 metastasis (bright orange color) consistent with viable tumor. There is no hyperperfusion associated at T5 consistent with normal marrow as well as with T9 consistent with treated metastasis. C, TICs demonstrate rapid wash-in and plateau (type C curve) for T7 lesion consistent with viable tumor, while normal T5 and treated tumor at T9 demonstrate relatively flat (type A) TIC.
Degenerative Disc Disease.
DCE-MRI played a pivotal role in examining the connection between intervertebral disc degeneration and lumbar vertebral marrow blood perfusion in the study conducted by Liu et al.29 Among 25 patients (50 vertebral bodies), the findings elucidated a potential correlation between lumbar vertebral marrow perfusion and intervertebral disc degeneration.29 They categorized patients into 3 groups based on disc conditions. Group 1, with vertebral bodies between normal and degenerated discs, showed significantly lower normalized peak enhancement (0.846 ± 0.060) compared with group 2, where each of the 2 vertebral bodies evaluated was between 2 normal discs (0.988 ± 0.047), and group 3, where each of the 2 vertebral bodies evaluated was between 2 degenerated discs (0.973 ± 0.081).29 Note that peak enhancement demonstrates intersubject variability for the same pathology. Thus, normalization of peak enhancement for each subject allows for more accurate comparison. The study demonstrates that vertebral marrow perfusion correlates with intervertebral disc degeneration; in particular, there is a 14% decrease in blood perfusion in vertebral bodies adjacent to degenerated discs when compared with vertebral bodies adjacent to normal discs in the same patient. This study demonstrates a correlation between lumbar vertebral marrow perfusion and intervertebral disc degeneration assessed through DCE-MRI.
Spinal Cord Injury.
Regarding understanding the progression of spinal cord injury (SCI) and its neurologic implications, Bilgen et al30 employed DCE-MRI. Their study over 42 days showcased the potential of DCE-MRI in understanding SCI progression and its correlation with neurologic changes. They observed early enhancement at the injury epicenter, indicating a compromised blood–spinal cord barrier. Initially, about 85% of the cord area at the epicenter showed enhancement within 15 minutes of contrast administration, gradually decreasing over time as motor functions improved.30 DCE-MRIs also identified small hyperintense regions around 2 weeks postinjury, potentially indicating new vessels with “leaky endothelium.” This study highlights DCE-MRI’s potential in understanding SCI progression and its link to neurologic changes.
Discrimination of Malignant and Benign Vertebral Compression Fractures.
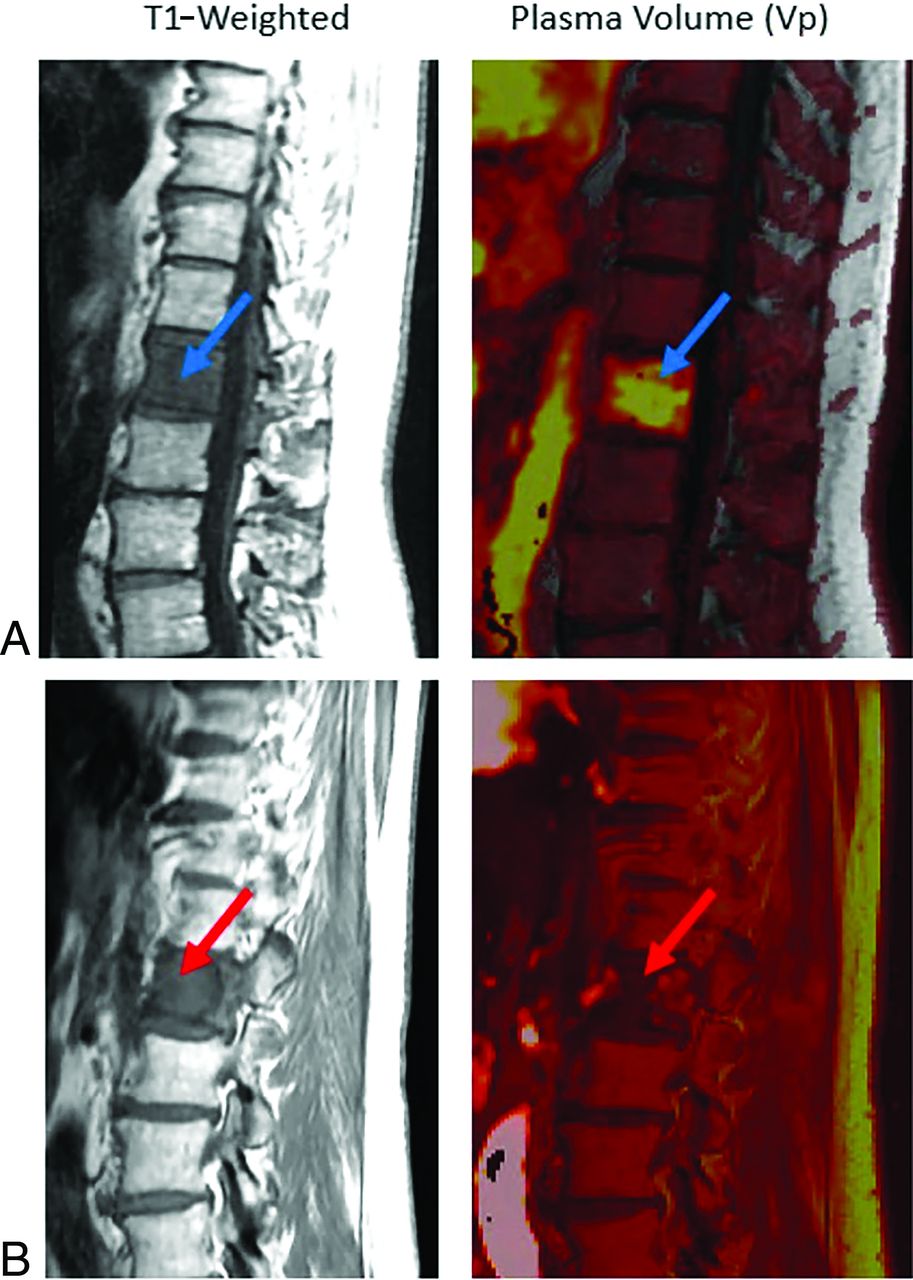
Elderly patients are at higher risk of spinal compression fractures, often secondary to underlying osteoporosis. Patients with metastatic or primary neoplastic disease may experience pathologic fractures in the spine. Additionally, patients with cancer experience a higher rate of benign compression fractures due to therapy-related changes and decreased mobility, highlighting the importance of a discriminatory tool for distinguishing non-neoplastic compression fractures from pathologic fractures.31,32 Therefore, in a patient with a history of cancer, it is crucial to be able to differentiate between a benign versus pathologic fracture due to implications for disease staging and prognosis. Conventional MRI is limited in diagnosing fractures of this kind, as malignant and benign fractures often appear similar on MR images. Although morphologic characteristics offer valuable insights, they have the potential to lead to misinterpretation. For instance, differentiating between pathologic fractures associated with multiple myeloma and osteoporotic fractures poses a considerable challenge in diagnostic scenarios. Moreover, the distinction in the origin of hyperintense signal on T2-weighted images between neoplastic disorders and acute fractures—mainly intracellular water in neoplastic conditions and interstitial water (edema) in acute fractures—adds complexity to characterizing fractures by using conventional MRI alone. Contrary to conventional MRI, DCE-MRI is suggested as a method to differentiate between pathologic and benign vertebral fractures (Fig 2).33,34 However, while DCE-MRI shows promise in this discrimination, its efficiency may be subject to considerations due to the extensive workflow required for image production and the current limited number of case studies available. Perfusion parameters Ktrans, Vp, wash-in slope, peak enhancement, and AUC were shown to allow for discrimination of malignant from benign fractures, as these values are significantly greater in pathologic fractures than benign fractures.33

Non-neoplastic versus pathologic compression fractures. A, Sagittal T1-weighted image demonstrates diffuse hypointense marrow replacing lesion within L1 consistent with breast carcinoma (blue arrow), with mild vertebral height loss consistent with compression fracture. There is expansion into the ventral epidural space in the setting of correlative elevated plasma volume on perfusion imaging (bright yellow on color map; green arrow), which suggests viable tumor. Constellation of findings is consistent with pathologic fracture. B, Sagittal T1 demonstrates hypointense lesion at superior T9 (blue arrow) without associated elevated plasma volume (dark signal on color map; green arrow) in a patient with lung carcinoma. Constellation of findings is consistent with non-neoplastic compression fracture.
Additionally, the correlation between histopathologic diagnosis of spinal lesions and Vp was shown via examining changes in patients who underwent DCE perfusion MRI before and after biopsy.26 Vp in spinal lesions was found to be significantly greater for malignant lesions (4.2) than for non-neoplastic lesions (1.6).26 Plasma volume maps further showed that malignant lesions had an increased signal intensity following contrast injection, while non-neoplastic lesions showed minimal changes in signal intensity.26 DCE-MRI was also able to detect tumor spread in the spinal canal and paraspinal muscles through detection of the perfusion signal in soft tissues surrounding the lesion beyond the spine.26
Atypical Hemangiomas Versus Metastases.
Vertebral hemangiomas are benign vascular tumors commonly found on the spine with a prevalence reported up to 41%.35 Vertebral hemangiomas often appear hyperintense on T1-pre contrast and T2-weighted sequences. Vertebral hemangioma signal intensity on STIR is variable depending on amount of vascularity versus fat composition. Thus, vertebral hemangiomas are characteristically hypointense on STIR. However, atypical hemangiomas have high vascularity and low-fat composition and may demonstrate lower signal intensity on T1 sequences and ultimately mimic primary or metastatic spine lesions, leading to misdiagnosis.36,37 Similar to the scenario involving a compression fracture in a patient with cancer (described above), it is often difficult (but clinically paramount) to differentiate between an atypical hemangioma and a metastasis. DCE-MRI can discriminate between atypical hemangiomas and spinal metastases caused by differences in signal intensity and morphology.
Morales et al36 assessed 42 patients with breast and lung carcinomas by using DCE-MRI and found that image analysis was able to discriminate between malignant vertebral metastases and vertebral atypical hemangiomas with P < .001. Spinal metastases have significantly higher perfusion parameters, Vp, and Ktrans than atypical hemangiomas (Fig 3). Qualitative assessment further demonstrated that spinal metastases have a type D curve (sharp rise, higher signal intensity peak, fast and clear washout), whereas atypical hemangiomas show little enhancement and plateau with no clear washout.36 Though the discussion in this paper is comprehensive, it’s crucial to note its reliance on a single study with a small patient cohort. This limitation emphasizes the necessity for larger-scale research to validate and extend these findings. Nevertheless, this study provides a valuable foundation for future exploration in this field.

Metastatic disease versus atypical hemangioma. Sagittal images demonstrate diffuse STIR hyperintense L1 lesion (top left, blue arrow) and smaller STIR hyperintense L3 lesion (gray arrow). Both lesions demonstrate T1 hypointensity (middle). Perfusion imaging (top right) demonstrates elevated plasma volume associated with the L1 lesion, which is suggestive of metastasis (subsequently, biopsy proved to be metastatic gastrointestinal tumor), and reduced plasma volume for the L3 lesion, which is suggestive of non-neoplastic etiology. In conjunction with anatomic appearance, the L3 lesion is most consistent with an atypical hemangioma. Bottom, The L1 lesion demonstrates type C TIC consistent with metastasis, and L3 lesion demonstrates flat TIC curve consistent with non-neoplastic lesion.
Differentiating Multiple Myeloma from Spinal Metastases.
Myeloma and metastatic lesions both affect bone marrow, often presenting as either single or multiple lesions and have overlapping imaging features. Lang et al38 evaluated the utility of DCE-MRI in distinguishing myelomatous osseous spine lesions from metastases. A retrospective study was performed with 9 myeloma and 22 metastases cases. Enhancement changes were quantified after normalizing with precontrast values for each case to account for enhancement variability when comparing different subjects. The myeloma group had a higher peak signal enhancement percentage (SE%) (226% ± 72% versus 165% ± 60%, P = .044), a higher steepest wash-in SE% (169% ± 51% versus 111% ± 41%, P = .01), a higher Ktrans (0.114 ± 0.036 versus 0.077 ± 0.028 1/min, P = .016), and a higher Kep (0.88 ± 0.26 versus 0.49 ± 0.23 1/min, P = .002). These results indicate that DCE-MRI can offer valuable supplementary information in distinguishing myeloma for spinal metastasis, thus allowing for an appropriate selection of treatments.
Differentiating Different Types of Metastases.
Spinal metastatic lesions can be characterized as hypervascular or hypovascular, depending on tumor pathology. Khadem et al39 compared the ability of conventional MRI and DCE-MRI to discriminate between hypervascular and hypovascular tumors of patients assigned to a group based on tumor pathology. DCE-MRI was able to discriminate between hypervascular and hypovascular tumors, as hypervascular tumors demonstrated a greater average wash-in enhancement slope (values over 21 arbitrary units [A/U]) and a significantly higher average peak enhancement signal percentage change in areas of highest wash-in enhancement slope.39 Conventional MRI was unable to differentiate between the 2 tumor types.39
Additionally, Meng et al40 evaluated 40 patients with untreated spinal osseous lesions preoperatively with DCE-MRI and correlated results with conventional angiography findings to identify DCE-MRI parameter cutoff values that would aid in classification of spinal tumors into hypervascular, moderate vascular, and hypovascular tumors. Results demonstrated that RSlopemax (ratio of slope of target lesion to that of normal marrow) cutoff value of 1.325 provided 87.5% sensitivity for characterizing hypovascular tumors and RSlopemax cutoff value of 1.85 provided 96.4% characterizing hypervascular tumors.40
Saha et al41 demonstrated that DCE-MRI analysis was successful in discriminating between hypovascular prostate and hypervascular renal cancer spinal metastases. Vp proved to be the optimal parameter regarding specificity, sensitivity, and ability to discriminate between spinal metastases.41 Vp exhibited the highest AUC and was 1.8 times greater for hypervascular metastases than for hypovascular metastases, the largest mean difference among all perfusion parameters.41 Peak enhancement signal percentage change was also a differentiator of the 2 metastasis types, as the value was larger for hypervascular metastases than for hypovascular metastases.41 Presurgical assessments of a spinal lesion via DCE-MRI would allow surgeons to assess if preoperative tumor embolization should be performed if the lesion is hypervascular to decrease intraoperative blood loss.
Utility of Perfusion Imaging in Intradural Spinal Lesions.
DCE-MRI has shown promise in allowing for evaluation of vascular parameters in intradural spinal lesions. Cuvinciuc et al42 evaluated the feasibility of performing DCE-MRI on 1.5T and 3T MRIs and obtaining relevant information. The study examined 15 patients with varying intradural spinal pathologies, including metastasis, glioblastoma, low-grade tumors, meningioma, and schwannoma. The results demonstrated that DCE-MRI was technically feasible at both field strengths; however, improved image quality was attributable at 3T because of higher signal-to-noise ratio and contrast-to-noise ratio. Additionally, perfusion pharmacokinetic modeling parameters from Tofts and extended Tofts were consistent across most pathologies except for highly vascular hemangioblastomas.42 This study illustrates that there is potential for extracting vascular characteristics for most intradural spinal lesions at various field strength magnets and Tofts models.
Differentiating Infection from Metastases.
DCE-MRI has also been shown to be able to distinguishing between vertebral malignancy and spinal tuberculosis. Verma et al43 employed DCE-MRI perfusion parameters in a prospective study of 45 patients, confirming histologic/cytologic diagnosis in 35 cases (19 tubercular and 16 malignant lesions) and revealed significantly higher mean Kep values in malignant lesions (2.89 ± 3.3) compared with tubercular ones (0.81 ± 0.19).41 Additionally, malignant lesions showed lower Ve values (0.27 ± 0.13 mL/g) compared with benign lesions (0.47 ± 0.12 mL/g) at a .05 significance level. A Kep cutoff of ≥1.17 min-1 demonstrated high sensitivity (93.8%), specificity (100%), and diagnostic accuracy (94.4%) in identifying malignant disease.43 The findings emphasize that elevated Kep serves as a strong indicator of malignant vertebral lesions and suggest a Kep cutoff value of ≥1.17 min-1 for accurate differentiation between vertebral malignancy and spinal tuberculosis.43
Monitoring Radiation Therapy Treatment Response Using DCE-MRI
Radiation Therapy Assessment for Spinal Metastases.
Radiation therapy leads to reduced blood flow in the tumor microvasculature. Therefore, DCE-MRI perfusion parameters, which can quantify changes in the vascular characteristics of a lesion, are the optimal technique to monitor tumor response following radiation therapy.
Chu et al44 observed changes in tumor physiology by using DCE-MRI in patients with spinal metastases before and after radiation therapy. A decrease in Vp best reflected a tumor’s successful response to radiation therapy (Fig 4). Successfully treated metastasis exhibited a decrease in Vp after radiation therapy while unsuccessfully treated tumors showed a substantial increase.44 Changes in AUC and peak enhancement displayed a similar pattern.44 TIC morphologies also demonstrated specificity for differentiating between viable disease and treated disease. Successfully treated tumors exhibited a type E (rapid wash-in then slow rise in contrast enhancement) curve, while unsuccessfully treated tumors maintained their type D (rapid wash-in then washout) curve shape.44 DCE-MRI was able to identify cases of successful treatment, which was confirmed on follow-up studies by tumor contraction, non-FDG avidity PET, or long-term stability.44 DCE-MRI has been shown to assist in predicting treatment success within 6 months of radiation therapy for most tumors, which is roughly one-half the time that it takes conventional MRI to predict treatment success.44

Patient with metastatic colon adenocarcinoma. A, Pretreatment scan that demonstrates T1 hypointense L1 lesion (top left, blue arrow) with associated elevated plasma volume (bright yellow on color map; top right, blue arrow) of 5.84, consistent with metastatic disease. B, A 2-month postradiation therapy scan that shows a near similar appearance of T1 hypointense lesion (bottom left, red arrow) but substantial decrease in associated plasma volume (dark signal on color map; bottom right, red arrow) of 1.65, which is a 72% reduction. Constellation of findings reflect treated disease despite similar appearance on anatomic T1-weighted images of pre- and posttreatment scans.
Chen et al45 explored the use of DCE-MRI for evaluating early outcomes of CyberKnife stereotactic radiosurgery in patients with spinal osseous metastases. Conventional MRI was performed before and 3 months status post-therapy. Patients demonstrating disease progression were categorized in the progressive disease (PD) group, and those showing complete response, partial response, or stable disease were defined as the non-PD group. DCE-MRI was also performed pre- and posttreatment. Perfusion parameters of Ktrans demonstrated significantly (P < .05) lower values in the posttreatment non-PD group (Ktrans of 0.959/min) when compared with the PD group. The study demonstrates that permeability parameter in DCE-MRI is valuable for determining early treatment response status post radiosurgery.
Lis et al46 observed changes in tumor physiology by using DCE-MRI in patients with spine metastases from prostate, thyroid, and renal cell carcinomas that underwent high-dose image-guided radiation therapy (HD-IGRT). Substantial changes were observed in perfusion parameters within 1 hour of HD-IGRT, highlighting the ability of DCE-MRI to detect lesion response almost immediately following treatment. Visual inspection of perfusion maps demonstrated a qualitative difference in Vp and Ktrans maps obtained before and 1 hour following radiation therapy. Quantitatively, a significant drop in Vp (average 65.2%) was observed following HD-IGRT of lesions.46 Ktrans exhibited a similar trend.46 These results were indicative of a successful response to treatment and were confirmed on long-term follow-up assessments during which no signs of tumor progression were detected for lesions that had concomitant low perfusion parameters.46
Prediction of Tumor Recurrence.
DCE-MRI also can predict local recurrence in tumors treated by high-dose radiation therapy with stereotactic radiosurgery.47 Kumar et al47 demonstrated that changes in Vp and Ktrans can predict local recurrence; the average change in Vp and Ktrans was higher among patients who had local recurrence than among those who did not. There was also a high correlation between significant decrease in Vp and successfully treated tumors that did not show local recurrence. Vp predicted local recurrence on average 6.6 months earlier than conventional MRI (Fig 5). Changes in Vp were the easiest screening parameter, with nearly perfect specificity (98%), sensitivity (100%), positive predictive value (91%), and negative predictive value (100%).47

Patient with metastatic lung adenocarcinoma to L4. A and B were obtained several months apart demonstrating T1 hypointense marrow replacing lesion involving L4 consistent with metastatic disease. A, First posttreatment scan after the patient received radiation 7 months prior. Top left, Metastasis at L4 (blue arrow). Top right, Lack of elevated plasma volume (dark signal on color map; blue arrow). B, Posttreatment scan 10 months subsequent to A and again with a similar T1 hypointense lesion in L4 (bottom left, red arrow). However, it is difficult to delineate simply based on anatomic imaging if the lesion remains viable or not, as both demonstrate similar T1 hypointensity. The L4 lesion now demonstrates correlative elevated plasma volume (bright signal on color map; bottom left, red arrow), which is consistent with a now-viable tumor reflecting recurrent disease.
Chordoma Treatment Assessment.
Chordomas are a rare type of cancer (1%–4% of osseous malignancies) that are locally invasive, aggressive, and prone to recurrence.48 Chordomas are diagnostically difficult because they often remain clinically silent on conventional MRI before demonstrating rapid progression, which then becomes difficult to treat.34,48
Santos et al25 explored the use of DCE-MRI to assess treatment response in patients with chordoma before and after radiation therapy. Physiologic changes in tumor vascularity were captured earlier on DCE-MRI than the morphologic changes that use conventional MRI. Perfusion changes were observed in at least 3/5 of the quantitative parameters evaluated through DCE-MRI measures (Vp max, Vp mean, Ktrans max, Ktrans mean, AUC) in all tumors examined (11/11), while morphologic change on conventional MRI was observed in 4/11 tumors. Conventional MRI indicated that 1 tumor underwent successful treatment and subjectively improved following radiation therapy; however, DCE-MRI measures demonstrated that the tumor was progressing. Vp and Ktrans decreased significantly in chordomas following radiation therapy treatment, as maximum Vp decreased by a factor of 1.6 following treatment, the most significant decrease among all parameters. The AUC on TICs also decreased after radiation therapy (Fig 6). Using DCE-MRI parameters to assess recurrence in chordomas rather than conventional MRI decreased detection time from 346 days to 120 days. DCE-MRI can serve as a more useful tool in monitoring early treatment efficacy and detecting early local recurrence in chordomas than conventional MRI.

Pre- and posttreatment assessment of chordoma. A, Pretreatment sagittal images (top row) with T1 hypointense (top left - blue arrow) and STIR hyperintense (top middle - blue arrow) marrow replacing S1–S4 lesion asymmetric to left sacral ala with associated hyperperfusion (bright signal on top right - blue arrow). B, Postradiation treatment sagittal images that show similar T1 hypointense (bottom left - red arrow) and STIR hyperintense mass (bottom middle - red arrow); however, there is significant decrease in perfusion (bottom right - red arrow) consistent with treatment response. TIC curves also demonstrate reduced TIC for treated disease.
Limitations
There are limitations to DCE-MRI in its utility for assessing tumor vascularity. There is a lack of standardization in the varying levels of complexity with which researchers approach DCE-MRI analysis. Selected contrast agents, DCE-MRI sequences, kinetic models, postprocessing algorithms, and means to acquire the AIF may differ among research studies from different institutions, thereby limiting the comparability of results from studies that use different techniques. However, the studies described above maintain reduced variability, as most were conducted at the same institution. The small sample size in many of these studies is further limiting; future studies with larger sample sizes will allow for greater generalizability of results and implications.
Despite its technological complexity, there is potential for geometric distortion, field inhomogeneity, fast versus slow compartment exchange, susceptibility artifacts, respiratory and cardiac pulsation artifacts, and T2* effect in T1-weighted DCE-MRI.39 DCE-MRI involves manually driven image analysis, which presents the possibility of human error. While DCE-MRI measures display improvements in relative sensitivity and specificity compared with conventional MRI, DCE-MRI is nevertheless unable to flawlessly optimize scanning parameters and spatial resolution, acquisition coverage, signal-to-noise, and temporal resolution, which often compete with each other. DCE-MRI requires high spatial resolution, acquisition coverage, and signal-to-noise, which often results in a suboptimal temporal resolution that may cause a low sampling rate and an unreliable AIF measurement.41
Analysis conducted after DCE-MRI also has some limitations. Semiquantitative differences in perfusion values before and after radiation therapy are not clearly defined,46 and the physiologic basis of semiquantitative parameters, such as AUC, peak enhancement, and wash-in, are unknown and do not simply relate to the quantitative permeability and tissue perfusion parameters evaluated.41 Quantitative analysis of DCE-MRI requires certain assumptions about tumors with regard to the chosen pharmacokinetic model. Because it is difficult to guarantee that all tumor or tissue types evaluated uphold the necessary assumptions, it is possible that a chosen pharmacokinetic model will not perfectly fit the DCE-MRI data acquired.46 To properly apply the 2-compartment pharmacokinetic model, there also must be an accurate assessment of the AIF, given that microvascular perfusion in a tissue is the concentration flow between the tissue and the artery. However, because of competition between scanning parameters, unreliable measurement of the AIF is possible. Unreliable measurement of the AIF can result in mis-sampling and saturation effects when the contrast agent is initially injected, thereby negatively impacting the time course and dispersion of the AIF before it reaches the region of interest.46 Additionally, while DCE-MRI can serve as a surrogate marker for tumor viability, biopsy of suspected lesions with pathologic evaluation remains the reference standard for assessing active disease.
Clinical Implications
DCE-MRI is a simple addition to most clinical MRI scanners that requires roughly 5 additional minutes of scanning time and provides greater insight into the condition of a tumor than conventional MRI. DCE-MRI is a robust and efficient technique for diagnosis, monitoring, and follow-up of patients with metastatic disease.34,49 Assessment of spinal metastases by using DCE-MRI measures can lead to a better understanding of a patient’s condition, a more optimized and individualized treatment plan, and improvement in oncologic patient care.
The capability of DCE-MRI measures to noninvasively characterize tissue vascularity can not only narrow the differential for primary tumor sites but can also discriminate between various types of metastatic osseous lesions.39 DCE-MRI measures can discriminate between hypervascular and hypovascular spinal metastases as well as other abnormalities such as inflammatory lesions or marrow changes related to therapy. DCE-MRI measures can also discriminate between benign acute and pathologic vertebral fractures, between atypical hemangiomas and vertebral metastatic lesions, and between non-neoplastic and malignant spinal lesions.26,33,36,39,41 The addition of DCE perfusion to standard MRI may improve diagnostic accuracy in the assessment of spinal malignancies and positively impact patient outcomes. Additional testing and the necessity for biopsy can likely be minimized, and hospital stay durations and patient anxiety can be reduced.
Changes in DCE-MRI blood perfusion parameters, specifically Vp and Ktrans, can provide insight into underlying tumor physiology in response to radiation therapy. These data can help to monitor tumor growth, predict local tumor recurrence, and act as a surrogate biomarker for assessing a lesion’s response to treatment. Patient treatment plans can be increasingly individualized and strategically modified if the current course of treatment is not working. DCE-MRI provides accessibility to useful data regarding tumor viability in a timelier manner than conventional MRI, thereby raising the likelihood of improved and more successful therapy outcomes.41
Future Directions
DCE-MRI has proved its ability to discriminate between select types of neoplastic and non-neoplastic lesions and has provided a basis to explore its utility in discriminating other spinal lesions. Further analysis of the differences in diagnostic ability between conventional MRI and DCE-MRI should be explored to better understand the degree of efficiency of DCE-MRI measures in predicting treatment response, as many studies currently demonstrate small sample sizes. Additionally, current predominant clinical practice in following response to therapy is through the imaging technique of PET. DCE-MRI and PET provide complementary information regarding a tumor; PET provides evaluation of the metabolic status of a tumor while DCE-MRI provides vascular characteristics, with Zhang et al50 showing no correlation between Ktrans and SUVmax. Advantages of DCE-MRI over PET are the lack of utilization of radiation and shorter total time to complete study. Future studies to compare the efficacy of DCE-MRI in comparison with PET to assess for treatment response will be of value. Understanding and improving current limitations would also greatly improve clinical outcomes for patients with spinal metastases.
Footnotes
Atin Saha and Haley Gibbs contributed equally to this article.
This research has been supported through the National Institutes of Health/National Cancer Institute Cancer Center (Grant P30 CA008748).
Disclosure forms provided by the authors are available with the full text and PDF of this article at www.ajnr.org.
References
- 1.
- 2.
- 3.
- 4.
- 5.
- 6.
- 7.
- 8.
- 9.
- 10.
- 11.
- 12.
- 13.
- 14.
- 15.
- 16.
- 17.
- 18.
- 19.
- 20.
- 21.
- 22.
- 23.
- 24.
- 25.
- 26.
- 27.
- 28.
- 29.
- 30.
- 31.
- 32.
- 33.
- 34.
- 35.
- 36.
- 37.
- 38.
- 39.
- 40.
- 41.
- 42.
- 43.
- 44.
- 45.
- 46.
- 47.
- 48.
- 49.
- 50.
- Received July 19, 2023.
- Accepted after revision June 12, 2024.
- © 2025 by American Journal of Neuroradiology