Abstract
BACKGROUND AND PURPOSE: Asymmetric atrophy of the hippocampus is an important clinical finding in normal aging and Alzheimer disease. In this study, we investigate the associations between the magnitude and asymmetry of hippocampal volumetric integrity and age, sex, and dementia severity.
MATERIALS AND METHODS: We have recently developed a rapid fully automatic algorithm to measure the hippocampal parenchymal fraction, an index of hippocampal volumetric integrity on structural MR imaging of the brain. We applied this algorithm to measure the hippocampal parenchymal fraction bilaterally on 775 MR imaging volumes scanned from 198 volunteers in a publicly available data base. All subjects were right-handed and older than 60 years of age. Subjects were categorized as cognitively healthy (n = 98), with mild cognitive impairment (n = 70), or with mild/moderate Alzheimer disease (n = 30). We used linear mixed-effects models to analyze the hippocampal parenchymal fraction and its asymmetry with respect to age, sex, dementia severity, and intracranial volume.
RESULTS: After controlling for age, sex, and intracranial volume, we found that the magnitude of the hippocampal parenchymal fraction decreased and its asymmetry increased significantly with dementia severity. Also, hippocampal parenchymal fraction asymmetry was significantly higher in men after controlling for all other variables, but there was no sex effect on hippocampal parenchymal fraction magnitude. The magnitude of the hippocampal parenchymal fraction decreased and its asymmetry increased significantly with age in subjects who were cognitively healthy, but associations with age were different in nature in the mild cognitive impairment and Alzheimer disease groups.
CONCLUSIONS: Hippocampal atrophy progresses asymmetrically with age in cognitively healthy subjects. Hippocampal parenchymal fraction asymmetry is significantly higher in men than women and in mild cognitive impairment/Alzheimer disease relative to cognitively healthy individuals.
ABBREVIATIONS:
- AD
- Alzheimer disease
- AI
- asymmetry index
- ART
- Automatic Registration Toolbox
- CN
- cognitively normal
- DX
- diagnostic group factor
- ICV
- intracranial volume
- HPF
- hippocampal parenchymal fraction
- LHPF
- left HPF
- MCI
- mild cognitive impairment
- RHPF
- right HPF
Alzheimer disease (AD) is the most common form of dementia, accounting for 60%–80% of all cases.1 Age is the greatest risk factor for late-onset AD; and with an aging population, it is projected that the annual number of new AD cases in the United States will double by 2050.1 There also appears to be a connection between AD and sex because women have an estimated double the lifetime risk for developing AD,1 and this cannot be solely explained by their higher average life expectancy of about 5 years.2
The hippocampus is a medial temporal lobe brain structure that plays a decisive role in the formation and retention of episodic memory and, in AD, is one of the first regions of the brain to experience atrophy.3 Structural MR imaging changes in the medial temporal lobe have been detected up to 10 years before clinical manifestations of AD.4 It is imperative to accurately characterize the patterns of hippocampal atrophy related to both normal aging and early AD, which would be extremely useful for developing new therapeutic interventions and monitoring disease progression. Numerous studies have shown significant reductions of hippocampal volume in mild cognitive impairment (MCI) and AD.5,6 Furthermore, many studies have reported hippocampal volume asymmetry in normal aging, MCI, and AD, with most reporting a right-greater-than-left asymmetry.6⇓⇓⇓–10
However, there have been some discrepancies in the literature over the nature of this putative hippocampal asymmetry. Some studies suggest that the observed asymmetry, at least in part, is due to a visual perception bias if the volumes are manually traced.11,12 Left-versus-right bias is also possible in automatic atlas-based hippocampal segmentation methods if care is not taken to ensure that a “symmetric method” is applied to measuring the bilateral hippocampi.8,10
Sex is an important factor to consider for an accurate study of hippocampal asymmetry. The possibility that sex may determine asymmetry in brain structure and function is supported by known examples, including sex-dependent patterns of regional asymmetry in medial temporal lobe areas13,14 and in lateralization of blood oxygen level–dependent fMRI activation in response to emotional15 and semantic processing tasks.16 Whether asymmetry in the hippocampus per se is affected by sex is not clear. Most studies do not report any sex-related differences in their measured asymmetries.6,8⇓–10 Maller et al7 did examine this question but did not find any sex difference in the degree of bilateral hippocampal asymmetry. Lucarelli et al,17 however, reported that men had greater asymmetry than women. There is also uncertainty as to whether the extent of asymmetry is the same between healthy subjects and MCI and AD groups,6 or whether asymmetry increases8 or decreases9 with increasing disease severity. These findings underline the need to further investigate the relationship among hippocampal asymmetry, sex, and disease severity. An improved understanding of these interactions toward a more precise patient-specific definition of disease-related changes was recently emphasized as a goal of the Alzheimer Precision Medicine Initiative.18
Hippocampal volume per se is not ideal for characterizing hippocampal degeneration. While atrophy of the hippocampus reduces its volume, the converse is not necessarily true—that is, a small volume does not necessarily indicate abnormality. For example, the raw hippocampal volumes in women are generally smaller than in men but the level of hippocampal atrophy is not different.7 Also, normal hippocampal volume is quite variable across subjects and is strongly influenced by intracranial volume (ICV) as a proxy for premorbid brain size.7,19,20 Due to these factors, it is difficult to detect subtle differences in hippocampal volume. To overcome this issue, we have recently developed a method to characterize the volumetric integrity of the hippocampus by measuring the hippocampal parenchymal fraction (HPF), an index that attempts to mimic how neuroradiologists visually identify abnormal-appearing hippocampi on MR imaging21—that is, when the hippocampal region contains larger-than-expected amounts of CSF.
In both AD22 and in first-episode psychosis,23 the HPF has been shown to be more sensitive than pure hippocampal volume in differentiating patients and controls. A cognitively normal (CN) versus early AD classification task using the HPF and its time rate of change achieved an accuracy of 97%.22 The same task using hippocampal volume and its time rate of change obtained from FreeSurfer, Version 5.3 (http://surfer.nmr.mgh.harvard.edu)24 achieved a lower accuracy of 89%.22 A group comparison of healthy controls versus medication-naïve patients with first-episode psychosis showed a significantly lower HPF in first-episode psychosis.23 However, hippocampal volume in the same subjects as measured by FreeSurfer, Version 6.0, failed to find any group differences.23 Furthermore, a follow-up scan after 8 weeks of treatment with antipsychotic medication showed a significantly reduced HPF from baseline in first-episode psychosis, whereas FreeSurfer volumes did not detect any longitudinal changes.23 The HPF has also been found to be a better predictor of future cognitive decline than volume.25
In this article, we measured the bilateral HPF on 3D volumetric MR imaging scans acquired from older adult subjects with and without AD-type dementia obtained through a publicly available data base. We then used linear mixed-effects statistical models to study the relationship between the magnitude and bilateral asymmetry of the HPF with respect to subject age, sex, and dementia severity.
Materials and Methods
Study Subjects
We obtained data from the publicly available Open Access Series of Imaging Studies,26,27 phase 1 (OASIS1, http://oasis-brains.org/), a cross-sectional collection of 416 right-handed subjects 18–96 years of age. In this study, we retained only a subset of 198 subjects who were 60 years of age or older. The 198 older subjects in the OASIS1 data base with and without dementia were recruited from the longitudinal pool of the Washington University Alzheimer's Disease Research Center. Subjects with a primary cause of dementia unrelated to AD such as vascular dementia, major depression, head injuries, strokes, and the use of psychoactive drugs and those with obvious lesions or other unrelated abnormalities in their MR images were excluded. Cohort demographics are shown in Table 1. Subjects were divided into 3 diagnostic groups: 1) cognitively normal (n = 98) with a Clinical Dementia Rating of zero; 2) mild cognitive impairment (n = 70) with a Clinical Dementia Rating of 0.5; and 3) AD (n = 30), twenty-eight subjects with a Clinical Dementia Rating of 1, and 2 with a Clinical Dementia Rating of 2.
Cohort demographicsa
MR Imaging Protocol
For each subject, 3 or 4 (six in 1 subject) individual sagittal 3D-T1-weighted MPRAGE structural MR imaging volumes were acquired in a single acquisition session using a 1.5T Magnetom Vision scanner (Siemens, Erlangen, Germany). The total number of volumes acquired from the 198 subjects in this study was 775. One hundred seventy-eight subjects had 4 volumes each, 19 subjects had 3 volumes each, and 1 subject had 6 volumes. The MPRAGE pulse sequence parameters were the following: matrix size = 256 × 256 × 128, voxel size = 1 × 1 × 1.25 mm3, TR = 9.7 ms, TE = 4.0 ms, TI = 20 ms, delay time = 200 ms, flip angle = 10° with a zero interslice gap. A more detailed description of image acquisition protocol can be found in Marcus et al.26
Imaging Processing
Image processing was performed using the Automatic Registration Toolbox (ART; https://www.nitrc.org/projects/art)28 software package in 2 steps. The 3–4 scans from each subject (6 scans in 1 case) were registered using the Automatic Temporal Registration Algorithm module of ART, an unbiased symmetric rigid-body affine registration algorithm. Registration results were visually inspected for accuracy.
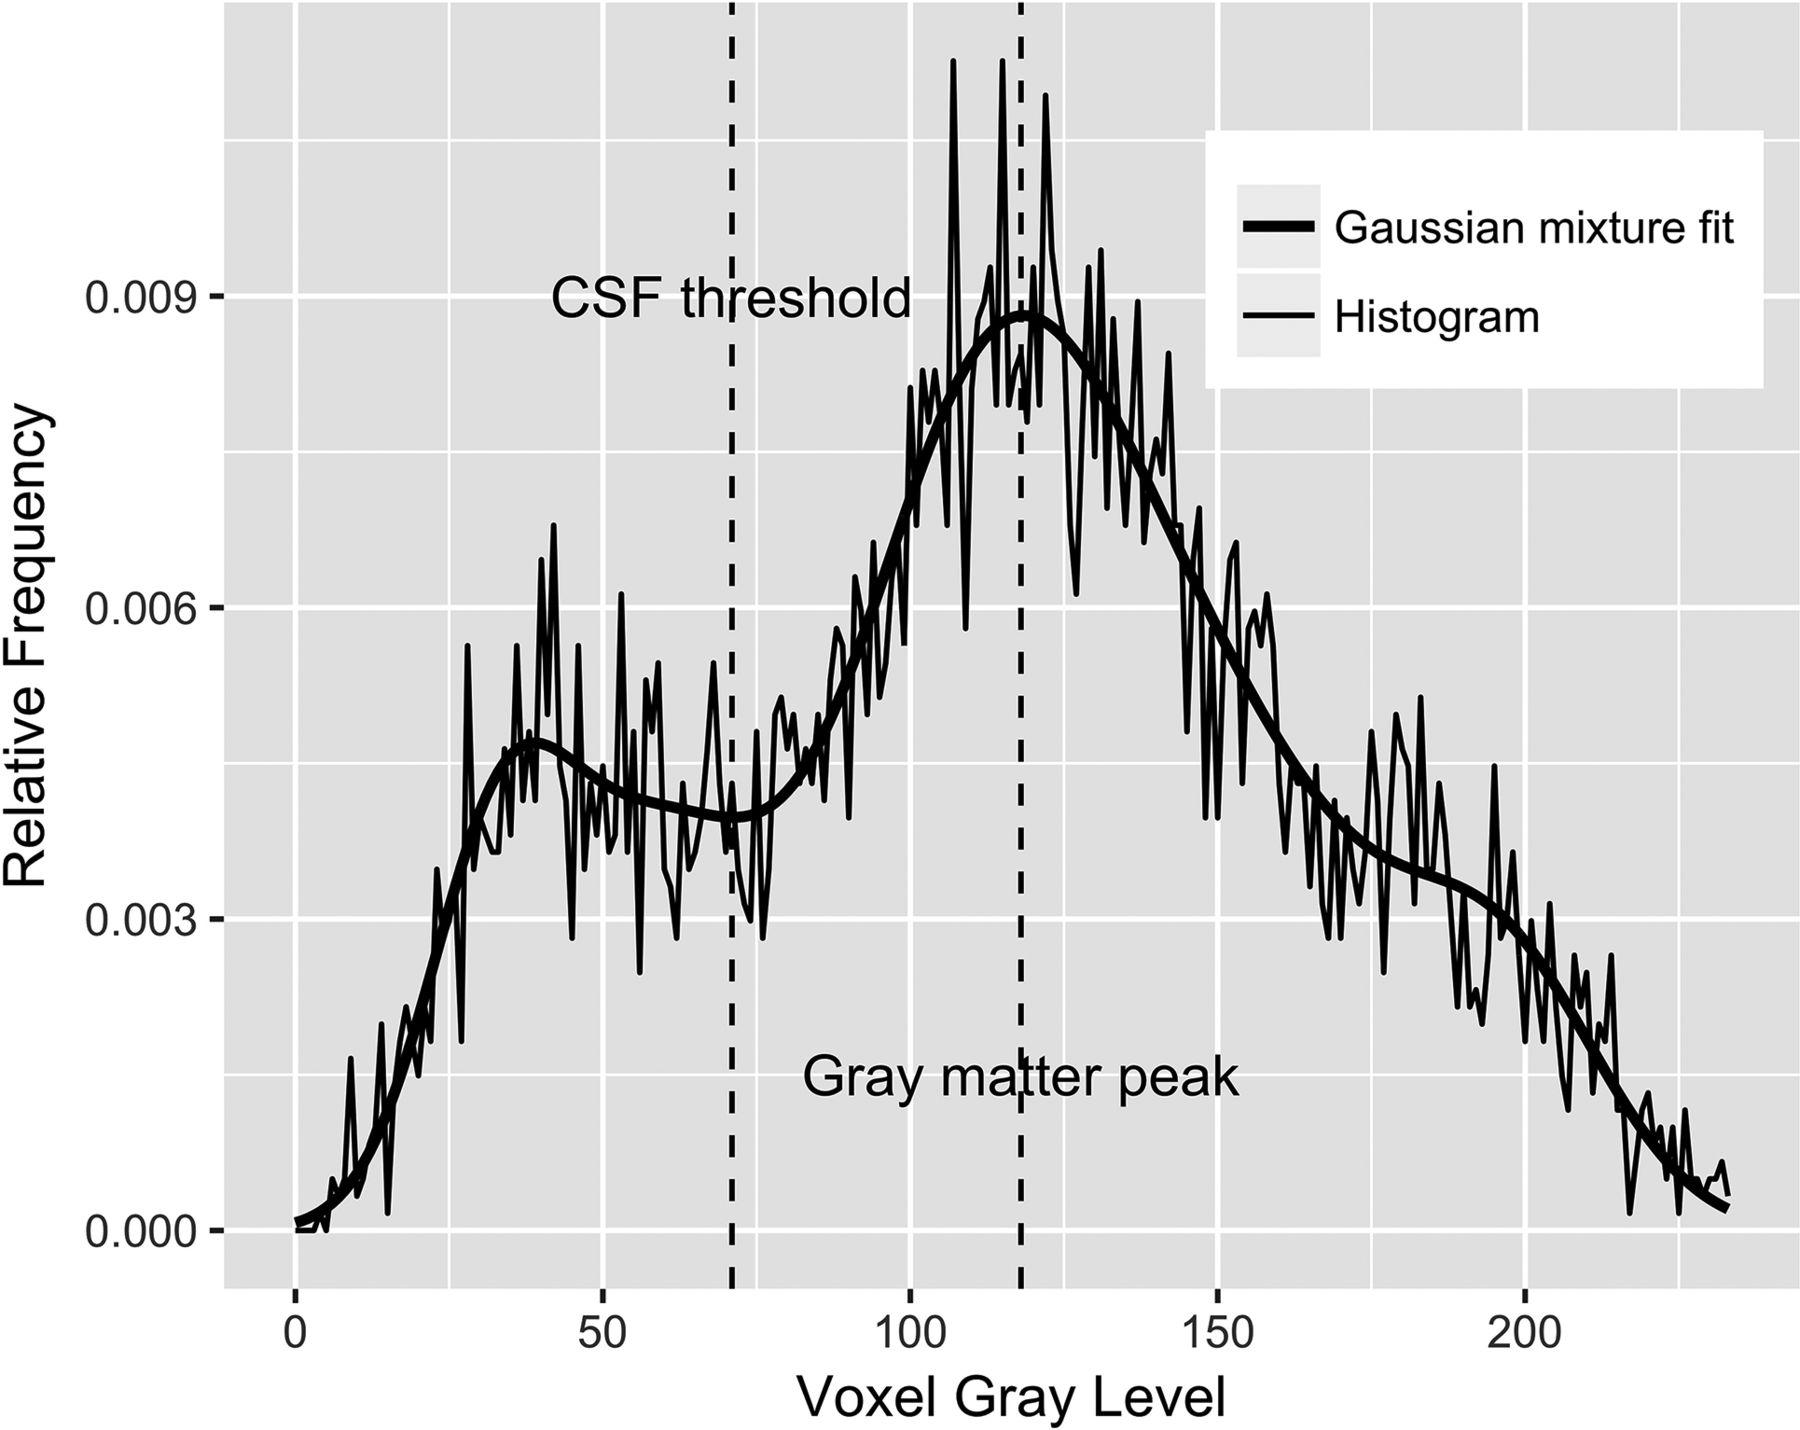
Following intrasubject registration, bilateral HPFs were measured on each of the 775 volumes using the KAIBA module in ART. The HPF estimates the fraction of brain parenchyma in a VOI that is automatically defined around each hippocampus. The VOI is the projection of a hippocampal probability map onto the MR imaging volume in its native orientation based on automatic detection of >100 landmarks near each hippocampus. The probability map is defined by the average of 65 manually traced hippocampi on a group of young healthy individuals. In a sense, the projection of this hippocampal probability map onto the subject's MR imaging volume indicates the location where one would expect to find the hippocampus in a healthy young individual. Because atrophy of the hippocampus is associated with a commensurate increase in the surrounding CSF, the HPF quantifies the extent to which brain tissue, as opposed to CSF, is found in the VOI. Figure 1 shows the projection of the probabilistic right hippocampal VOI onto the native space of a raw 3D MPRAGE volume. KAIBA examines the voxel-intensity histogram in the VOI. A Gaussian mixture model is fitted to the histogram using the expectation-maximization algorithm. The fitted mixture model is then analyzed to obtain a CSF threshold as shown in Fig 2. Finally, the HPF is computed as the ratio of the volume of the suprathreshold voxels to the total VOI.

Axial (left), coronal (middle), and sagittal (right) slices through a 3D structural MR imaging scan of a subject. The right hippocampus probabilistic VOI is superimposed on the image in native space.

Histogram of the voxels with nonzero probabilities on the VOI in Fig 1 (thin line) along with a fitted Gaussian mixture model (thick line) using the expectation-maximization algorithm. The automatically determined CSF threshold is shown as a vertical line approximately located at the intensity value of 70. The HPF is defined as the fraction of voxels in the VOI whose intensities are greater than the CSF threshold.
KAIBA is carefully designed to avoid any possible left-right bias in measuring the HPF by computing the bilateral HPF twice, once in the original volume and a second time in a duplicate volume obtained by flipping through the left-right axis and then averaging the measured HPFs for each hemisphere.
On the basis of the measured left HPF (LHPF) and right HPF (RHPF), we computed an overall bilateral measure of hippocampal volumetric integrity as the average:
 and a percentage asymmetry index (AI):

As with Lucarelli et al,17 in this study, the AI measures the magnitude of asymmetry without regard to its direction.
Statistical Analysis
We used the lmer function of the lme4 package (Version 1.1–17; https://cran.r-project.org/web/packages/lme4/index.html) in the R statistical computing and graphics language (Version 3.5.0; http://www.r-project.org) to fit linear mixed-effects models to the response variables HPF and AI to analyze their relationships to covariates: age, sex, diagnostic group, and estimated total intracranial volume. The significance of the fixed-effects parameters was tested using the ANOVA function of the lmerTest package (Version 3.0–1; https://cran.r-project.org/web/packages/lmerTest/index.html) with the Satterthwaite method for computing the denominator degrees of freedom and F statistics.
Examination of model residuals following fitting of the mixed-effects models indicated considerable departure from the assumed normality of the residuals. The problem was mitigated by applying the logit transformation (3a) and the Box-Cox transformation29 (3b) to the response variables HPF and AI, respectively, as follows:

 where the Box-Cox transformation parameter λ in 3b was estimated using the R boxcoxmix package (Version 0.20; https://cran.r-project.org/web/packages/boxcoxmix/boxcoxmix.pdf) to be λ = 0.4.
Because we have 775 MR imaging volumes, we denote our response variable by yi (i = 1, 2, …, 775), where yi represents either logit(HPF) or boxcox(AI). We fitted the following mixed-effects model:

This model involves 10 unknown parameters that are estimated. These are the 8 fixed effects, β0–β7, and 2 variance components σb2 and σe2 associated with random effects bj and residuals ei, respectively. In this model, the diagnostic group factor (DX) is a fixed factor with 3 levels, CN, MCI, and AD, indicating the diagnostic group; ID is a random factor with 198 levels j = 1, 2, …, 198, corresponding to the individual study subjects with bj as the corresponding random effects. Sex is a fixed factor with 2 levels; and Age and intracranial volume (ICV) are continuous mean-centered covariates. The precise definitions of all mathematic terms and notations in Equation 4 are given in Table 2.
Definitions of all mathematic terms used in the mixed-effects model equation (Equation 4)
Results
Image Processing
The Automatic Temporal Registration Algorithm relies on methods for automatic detection of the midsagittal plane and anterior/posterior commissure. Visual inspection revealed that in 13 of the 775 volumes (1.7%), the midsagittal plane anterior/posterior commissure detection failed. These volumes belonged to 4 different subjects in our cohort of 198 (2%). In the 13 failed cases, we supplied the program with 3 manually identified landmarks on the midsagittal plane, following which the program proceeded to successfully complete the registrations. Following Automatic Temporal Registration Algorithm registrations, KAIBA successfully computed LHPF and RHPF on all 775 volumes. All the following statistical results pertain to the transformed response variables HPF and AI using Equations 3a and 3b.
Statistical Analysis of AI
Statistically significant variance in AI was explained by the DX (P < .001), Sex (P < .01), and ICV (P = .02). In addition, there was a significant DX-by-Age interaction (P < .001).
AI versus Diagnostic Group
Figure 3 shows the predicted marginal mean and 95% confidence interval of AI in the CN, MCI, and AD groups. Pair-wise comparisons among the 3 diagnostic groups showed a significant increase in asymmetry with dementia severity: CN vs MCI (P < .001), CN vs AD (P < .001), and MCI vs AD (P = .03). The P values are adjusted using the Tukey method for comparing a family of 3 estimates.

Predicted marginal means of the asymmetry index in different diagnostic groups. AI was found to be significantly different between the CN versus MCI (P < .001), CN versus AD (P < .001), and MCI versus AD (P = .03) groups. AI increased with increasing dementia severity. Error bars indicate 95% CI.
AI versus Sex and ICV
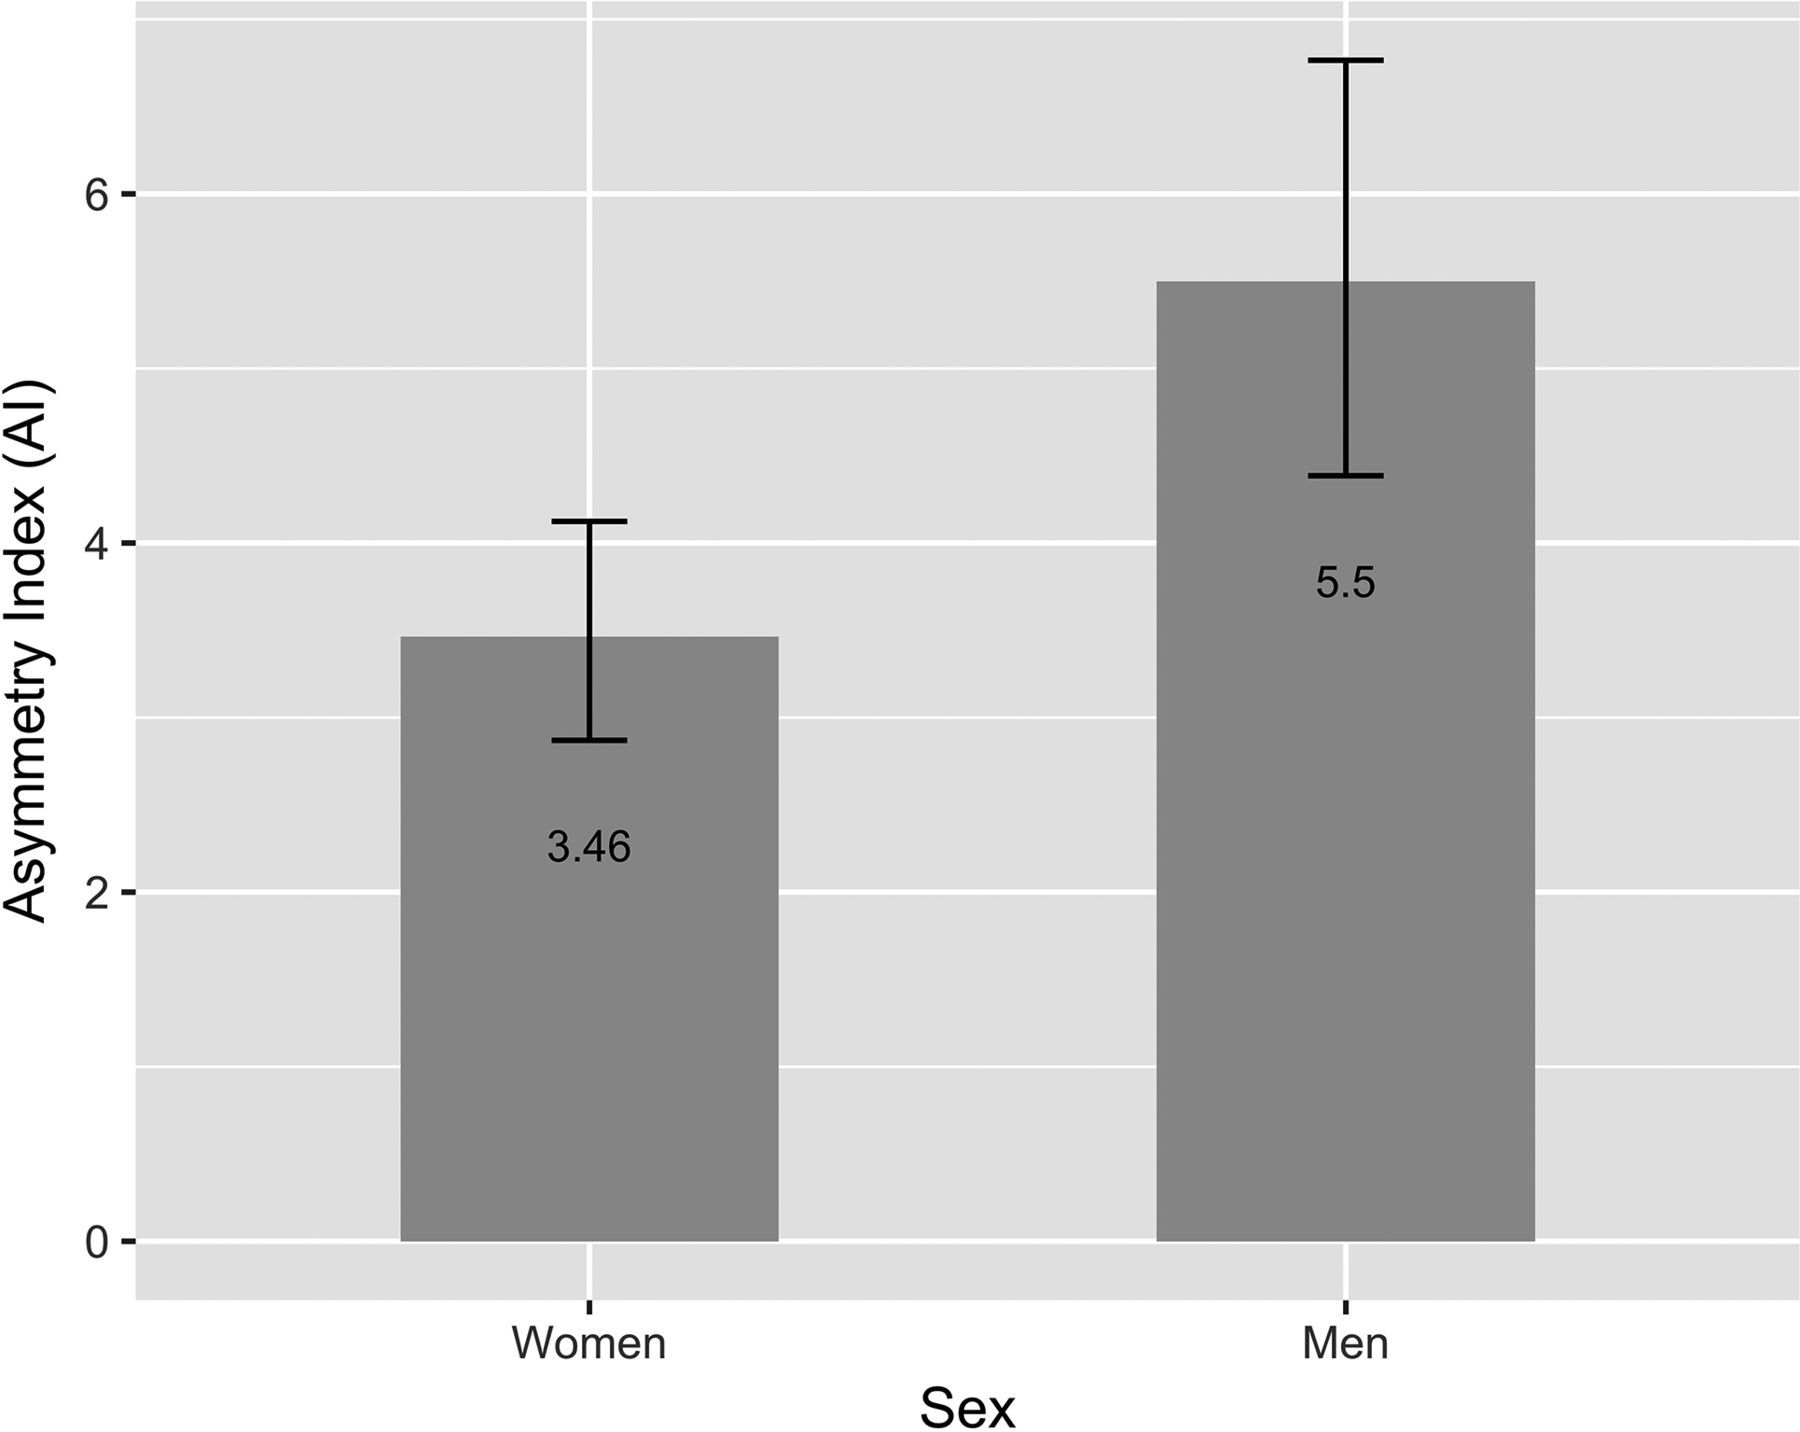
Figure 4 shows the predicted marginal mean and 95% CI of AI in men and women. There was a significant main effect of sex on AI as indicated by β7 in the fitted Equation 4 that was significantly different from zero (P < .01), showing higher asymmetry in men. Our analysis also suggested that asymmetry decreased with increasing ICV as indicated by the significantly negative β6 (P = .02) in the fitted Equation 4.

Predicted marginal means of the asymmetry index in men and women. The AI was found to be significantly higher in men (P < .01) after controlling for age, intracranial volume, and diagnostic group. Error bars indicate 95% CI.
AI versus Age and Diagnostic Group
Fitting of Equation 4 to AI also revealed significant age-by-diagnosis interactions. In CN, asymmetry increased significantly with age as indicated by a positive β1 (P < .001). However, in the MCI group, asymmetry decreased with age as indicated by a significantly negative linear combination β1 + β4 (P < .05). Finally, in the AD group, we found no significant age effect on AI by testing the linear combination β1 + β5 (P = .13).
Statistical Analysis of HPF
Statistically significant variance in the HPF was explained by the DX (P < .001), Age (P < .001), and ICV (P = .001). In addition, there was significant DX-by-Age interaction (P < .01).
HPF versus Diagnostic Group
Figure 5 shows the predicted marginal mean and 95% CI of HPF in the CN, MCI, and AD groups. Pair-wise comparisons among the 3 diagnostic groups showed significant decrease in the HPF with dementia severity: CN vs MCI (P < .001), CN vs AD (P < .001), and MCI vs AD (P < .001), in which the P values are adjusted using the Tukey method for comparing a family of 3 estimates.

Predicted marginal means of the HPF (averaged across hemispheres) in different diagnostic groups. The HPF was found to be significantly different between the CN versus MCI (P < .001), CN versus AD (P < .001), and MCI versus AD (P < .001) groups. The HPF decreased with increasing dementia severity. Error bars indicate 95% CI.
HPF versus Sex and ICV
There was no significant sex effect on the HPF as indicated by a β7 estimate, which was not significantly different from zero (P =.23). Our analysis showed that the HPF decreased with increasing ICV as indicated by a significantly negative β6 (P = .001).
HPF versus Age and Diagnostic Group
Fitting of Equation 4 to the HPF revealed significant age-by-diagnosis interactions. In the cognitively healthy group, HPF decreased significantly with age as indicated by a negative β1 (P < .001). The HPF also decreased with age in the MCI group as indicated by a significantly negative linear combination β1 + β4 (P < .001). Finally, in the AD group, we found no significant age effect on the HPF by testing the linear combination β1 + β5 (P = .13).
Discussion
In this article, we examined the magnitude and asymmetry of hippocampal volumetric integrity in normal aging, MCI, and AD-type dementia based on measurement of the hippocampal parenchymal fraction. We found that the asymmetry of hippocampal atrophy increased with age in subjects who were cognitively normal and it was more asymmetric in men than women (Fig 4). These findings agree with the results of Lucarelli et al,17 who found that the asymmetry of hippocampal volume increased with age and that men had greater asymmetry than women.
Our findings also concur with the recent longitudinal study by Fraser et al,30 who reported the rate of decline of hippocampal volume measured by very reliable manual tracing by the same highly trained neurologist in 244 middle-aged and 199 older- aged healthy adults based on a pair of baseline and follow-up structural MR images from each individual scanned 8 years apart. They found that the rate of decline of the left hippocampus was higher than that of the right hippocampus in both groups, which indicates increasing AI in normal aging. Sex differences in the rates of decline were not examined.
We also found that both the MCI and AD groups had significantly higher hippocampal asymmetry than the CN group and that the AD group had significantly higher hippocampal asymmetry than the MCI group (Fig 3). Therefore, we conclude that the extent of hippocampal asymmetry as measured by AI is positively correlated with dementia severity. These results are consistent with those of Wachinger et al,8 who reported an increase in hippocampal asymmetry concurrent with disease severity beyond an aging effect.
Examining the definition of AI given by Equation 2, we can see that AI can increase with decreasing HPF in the denominator or increasing |RHPF–LHPF| in the numerator or both. We have shown in this study that the HPF decreases with dementia severity (Fig 5); therefore, the increase in AI is, in part, due to decreasing HPF. We also examined the relationship between |RHPF–LHPF| and disease severity (results not reported) and determined that this quantity increased significantly in both MCI and AD groups relative to CN. An increase in the mean value of |RHPF–LHPF| itself can be attributed to 2 factors. Assuming that the difference between the right and left HPF is normally distributed, the probability distribution of |RHPF–LHPF| would be the so-called folded normal distribution whose expected value depends on both the mean and variance of RHPF–LHPF. In other words, the increasing AI with disease severity could also be partly due to a larger variance in right-left differences in the MCI/AD groups.
We also found an interaction between age and diagnostic group on asymmetry. While asymmetry increased with age in the group that was cognitively normal, asymmetry was observed to decrease with age in both MCI and AD groups, though the association between age and asymmetry in AD did not reach statistical significance, likely due to the smaller sample size in this group. The finding of a negative correlation between age and asymmetry in the MCI and AD groups indicates that hippocampal asymmetry is higher in those with earlier onset of the disease, suggesting that those who experience earlier onset are more acutely impaired. This finding is consistent with the observation that those with earlier disease onset have a more severe disease course.31
Furthermore, we found that the HPF decreased significantly from CN to MCI and from MCI to AD (Fig 5). This is consistent with numerous previous publications that report a compromised hippocampal volumetric integrity in AD compared with controls.5,6 We also found that the HPF significantly decreased with age in both the CN and MCI groups, but the association between the HPF and AD did not reach statistical significance. The latter result may be due to the smaller sample size (n = 30) in this group; and second, the more advanced dementia in this group means that the compromised hippocampal volumetric integrity is more influenced by the time since dementia onset than by subject age. This finding is consistent with previous reports indicating that the loss of hippocampal volume and changes in shape are more closely related to age in the healthy controls than in patients with dementia.32
Taken together, our results suggest that decreased magnitude and increased asymmetry of the HPF beyond what is expected in normal aging have the potential to be used as early imaging biomarkers of AD. Our results also confirm a sexual dimorphism in asymmetric hippocampal atrophy patterns in both normal aging and AD, with men having significantly more asymmetry.
In this article, we have considered only hippocampal degeneration. Future work is required to determine whether the asymmetric pattern of neurodegeneration is specific to the hippocampus or whether it extends to other brain regions.
We used cross-sectional data in this study and therefore were not able to ascertain the rates of change of HPF asymmetry. A future direction of research is to use longitudinal data bases to study dynamic changes in asymmetry in subjects with normal aging and AD. Previously, we used the magnitude of HPF and its rate of change with respect to time as features in machine learning algorithms used for differentiating healthy subjects from those with AD,22 as well as for differentiating stable patients with MCI from those with an incipient AD diagnosis.33 Future studies will need to be conducted to assess the influence of including HPF asymmetry and its rate of change as additional classification features on the performance of machine learning algorithms.
Conclusions
In this article, we analyzed the hippocampal volumetric integrity as measured by HPF and its asymmetry as measured by AI with respect to age, sex, and dementia severity. We found that the extent of HPF asymmetry is greater in patients with AD than in normally aging subjects and that men had more hippocampal asymmetry than women. We also found that the extent of hippocampal asymmetry is positively correlated with age in cognitively healthy subjects but no statistically significant relationship between HPF asymmetry and aging was found within the AD group and that asymmetry diminished with aging within the MCI group. In addition to the level of hippocampal volumetric integrity, its asymmetry can potentially be used as an early biomarker of AD.
References
- 1.
- 2.
- 3.
- 4.
- 5.
- 6.
- 7.
- 8.
- 9.
- 10.
- 11.
- 12.
- 13.
- 14.
- 15.
- 16.
- 17.
- 18.
- 19.
- 20.
- 21.
- 22.
- 23.
- 24.
- 25.
- 26.
- 27.
- 28.
- 29.
- 30.
- 31.
- 32.
- 33.
- Received June 21, 2018.
- Accepted after revision December 9, 2018.
- © 2019 by American Journal of Neuroradiology