
Abstract
BACKGROUND AND PURPOSE: Differentiating the types of pediatric posterior fossa tumors on routine imaging may help in preoperative evaluation and guide surgical resection planning. However, qualitative radiologic MR imaging review has limited performance. This study aimed to compare different machine learning approaches to classify pediatric posterior fossa tumors on routine MR imaging.
MATERIALS AND METHODS: This retrospective study included preoperative MR imaging of 288 patients with pediatric posterior fossa tumors, including medulloblastoma (n = 111), ependymoma (n = 70), and pilocytic astrocytoma (n = 107). Radiomics features were extracted from T2-weighted images, contrast-enhanced T1-weighted images, and ADC maps. Models generated by standard manual optimization by a machine learning expert were compared with automatic machine learning via the Tree-Based Pipeline Optimization Tool for performance evaluation.
RESULTS: For 3-way classification, the radiomics model by automatic machine learning with the Tree-Based Pipeline Optimization Tool achieved a test micro-averaged area under the curve of 0.91 with an accuracy of 0.83, while the most optimized model based on the feature-selection method χ2 score and the Generalized Linear Model classifier achieved a test micro-averaged area under the curve of 0.92 with an accuracy of 0.74. Tree-Based Pipeline Optimization Tool models achieved significantly higher accuracy than average qualitative expert MR imaging review (0.83 versus 0.54, P < .001). For binary classification, Tree-Based Pipeline Optimization Tool models achieved an area under the curve of 0.94 with an accuracy of 0.85 for medulloblastoma versus nonmedulloblastoma, an area under the curve of 0.84 with an accuracy of 0.80 for ependymoma versus nonependymoma, and an area under the curve of 0.94 with an accuracy of 0.88 for pilocytic astrocytoma versus non-pilocytic astrocytoma.
CONCLUSIONS: Automatic machine learning based on routine MR imaging classified pediatric posterior fossa tumors with high accuracy compared with manual expert pipeline optimization and qualitative expert MR imaging review.
ABBREVIATIONS:
- AUC
- area under the curve
- AutoML
- automatic machine learning
- CHSQ
- χ2 score
- EP
- ependymoma
- MB
- medulloblastoma
- ML
- machine learning
- PA
- pilocytic astrocytoma
- TPOT
- Tree-Based Pipeline Optimization Tool
Among childhood malignancies, pediatric brain tumors are the second most common and the leading cause of death from solid tumors.1,2 Posterior fossa tumors make up a disproportionate portion of brain tumors in the pediatric population, accounting for 54%–70% of tumors compared with <20% in the adult population.3 The most common subtypes of posterior fossa tumors among children are medulloblastoma (MB), pilocytic astrocytoma (PA), and ependymoma (EP).4,5 Discrimination of these 3 malignancies is important due to the differing natural histories and prognoses for each. Accurate preoperative diagnosis could also help in preoperative evaluation and guide surgical planning for patients with different types of tumors.5,6 MR imaging review is essential for tumor diagnosis and evaluation. However, it is usually far from being a criterion standard, which is diagnosis by histology.
The rapid growth in the field of medical image analysis in the past decade has facilitated the development of radiomics, which converts digital images to mineable data via high-throughput extraction of a large number of quantitative features.7 The radiomics model has the potential power to improve predictive performance8 and has been used to improve the differentiation among different brain tumors such as glioblastoma and anaplastic oligodendroglioma,9 and metastatic brain tumors.10 However, there have been few studies exploring the classification of pediatric posterior fossa tumors using a radiomics analysis on clinical routine MR imaging.
Machine learning (ML) is a method of data analysis that automates analytic model building. It is a branch of artificial intelligence in which systems are designed to learn from data, identify patterns, and make decisions with minimal human intervention.11 In recent years, machine learning approaches for radiomics feature selection have developed rapidly. However, few studies have compared these recently developed feature-selection methods and predictive modeling methods.12 Therefore, selection of the most accurate ML pipeline often requires extensive manual testing by an expert in machine learning.
The Tree-Based Pipeline Optimization Tool (TPOT; https://pypi.org/project/TPOT/) is a specific open-source form of automated machine learning (autoML) that automatically chooses the most optimal machine learning pipeline without the need for human intervention.13,14 TPOT has been benchmarked on many simulated and real-world supervised classification tasks.14 However, performance of automated TPOT still needs to be proved in different types of data by comparison with manually optimized feature selection and classification.
The primary goal of our study was to investigate the value of autoML (TPOT) to differentiate the main types of pediatric posterior fossa tumors on routine MR imaging and to compare its performance with manual expert optimization and qualitative expert MR imaging review.
MATERIALS AND METHODS
Patient Cohort
All patients included were newly diagnosed with histologically confirmed MB, EP, or PA from 4 large academic hospitals in the Hunan Province in China from January 2013 to December 2018. The study was approved by the institutional review boards of all participating institutions. The inclusion criteria were the following: 1) pathologically confirmed MB, EP, or PA; 2) available preoperative MR imaging examination including a T1-weighted contrast-enhanced sequence, a T2-weighted sequence, and ADC maps; and 3) quality of the images adequate for analysis, without motion or artifacts. All patients included in the analysis did not undergo any treatment before MR imaging. Patients’ age and sex were collected and incorporated into the radiomics analysis as clinical variables.
MR Imaging Acquisition
The MR imaging was performed using 3T scanners (Magnetom Trio, Siemens, n = 168 patients; Achieva, Philips Healthcare, n = 87) or 1.5T scanners (Avanto, Siemens, n = 33). The main MR imaging protocols across hospitals used in our study are listed in On-line Table 1. ADC images were calculated from acquired DWI with b-values of 0- and 1000-s/mm2.
Image Segmentation
MR images of all patients were loaded into 3D Slicer software (Version 4.10; http://www.slicer.org), which was used as a user-driven manual active contour-segmentation tool to segment tumor volumes. ROIs were manually drawn section by section on the T2WI, T1WI contrast-enhanced sequence, and ADC images by 2 authors (H.Z., with 7 years of clinical experience in neuroradiology, and L.T., with 5 years of clinical experience in neuroradiology). The ROIs defined in our study include both the enhancing and nonenhancing components of tumor as well as peritumoral edema. On-line Figure 1 shows an example of ROI delineation on a T1WI contrast-enhanced sequence, T2WI, and ADC maps. The intraclass correlation coefficient value was used to assess interobserver reproducibility of generated masks.
Radiomics Feature Extraction
Radiomics features were extracted from each patient’s MR imaging for the T1WI contrast-enhanced sequence, T2WI, and ADC maps. For each image space, 79 nontexture (morphology and intensity-based) and 94 texture features were extracted according to the guidelines defined by the Image Biomarker Standardization Initiative.15 Each of the 94 texture features was computed 32 times using all possible combinations of the following extraction parameters, a process known as “texture optimization”:16 1) isotropic voxels of 1, 2, 3 , and 4 mm; 2) a fixed bin number discretization algorithm, with and without equalization; and 3) the number of gray levels of 8, 16, 32, and 64 for a fixed bin number. A total of 79 + 32 × 94 or 3087 radiomics features were thus computed in this study. All the features were normalized using unity-based normalization, and features from the T1WI contrast-enhanced sequence, T2WI, and ADC maps were combined into 1 dataset.
Radiomics Model Building and Analysis
Before radiomics analysis, all included tumor cases were randomly divided into a training set (70% of cases) and testing set (30% of cases). All the radiomics features extracted above with clinical variables (age and sex) were incorporated to train multiclass models for MB, EP, and PA. Different binary models were trained for MBs versus non-MBs, EPs versus non-EPs, and PAs versus non-PAs. An automated optimized pipeline was computed on the dataset by TPOT, which chooses the most optimal machine learning pipeline for an inputted dataset through genetic programming.17 The following settings were used in the optimization process: number of generations, 5; population size, 5; and 5-fold cross-validation on the training set. In this study, the TPOT pipeline was replicated 10 times to yield 10 different models for comparison. The model with the best performance was finally selected and tested on the testing set.
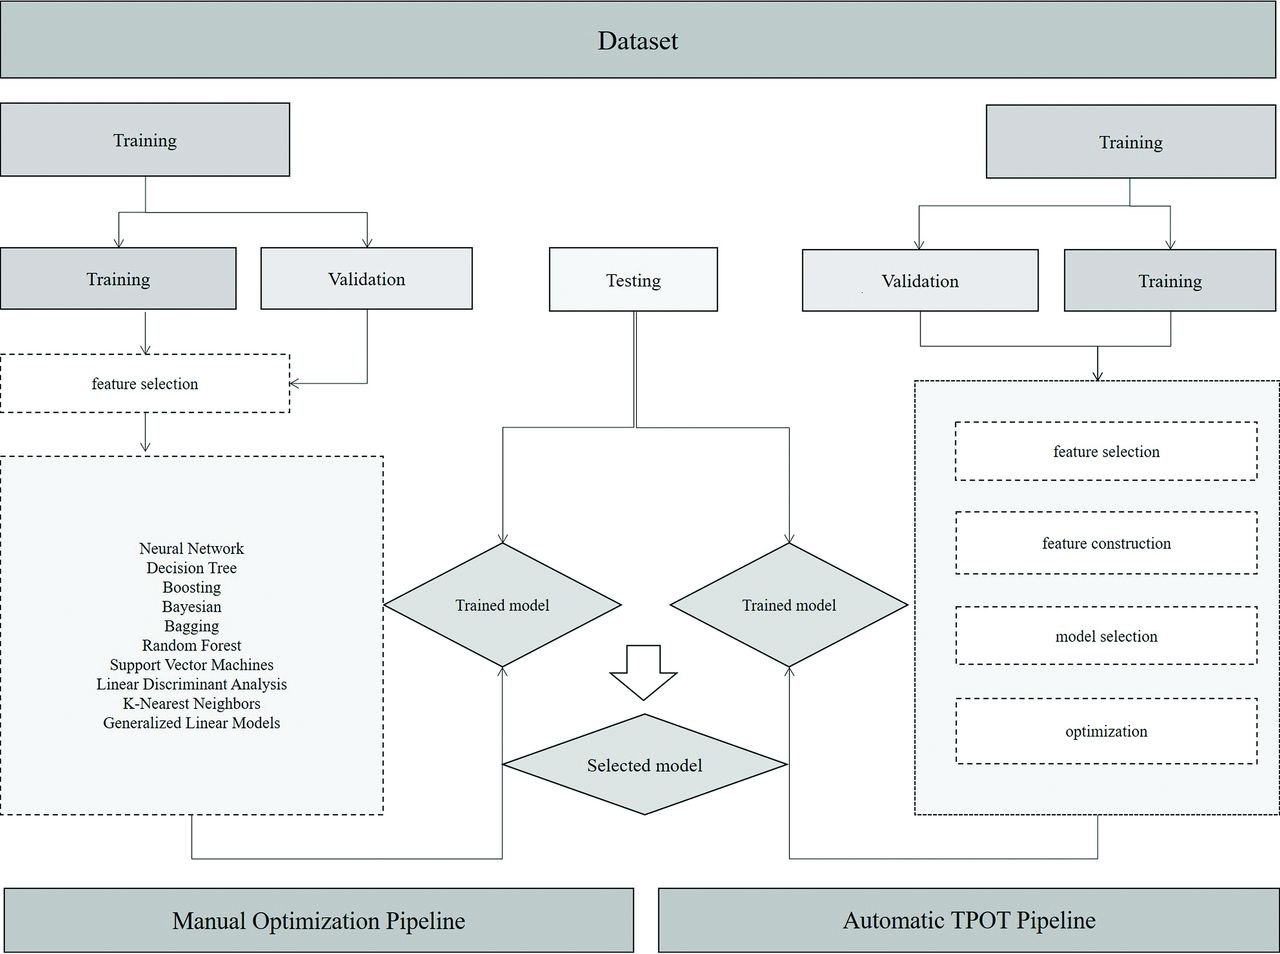
For the manual expert optimized pipeline, radiomics features were selected for training using 13 different feature-selection methods to reduce the dimensionality of the datasets. Ten machine learning classifiers were trained to yield diagnostic models. Details of the feature-selection methods and classifiers used are shown in On-line Table 2. Each classifier was trained on the training set 13 times using 13 different feature-selection methods and was validated through 5-fold cross-validation. Classifiers were trained on 10, 20, 50, and 100 selected features, and performances on the training set were recorded. The best-performing models on the training set were then tested on the final testing set. When there were multiple combinations with the same cross-validation results on the training set, the combination with the best performance on the testing set was selected. In addition to performance, the stability of classifiers was recorded. The relative SD for classifier stability was calculated. More details and the results of the stability calculations can be found in On-line Table 3. Figure 1 provides the workflow of the machine learning algorithms used in this study.

Machine learning workflow.
Expert Evaluation
The final performance of the model on the test set was compared with 2 expert radiologists’ interpretations: Q.S. and J.W. with 7 and 5 years of experience reading brain MR imaging, respectively. The experts were blinded to all clinical data and histopathologic information.
Statistical Analysis
The following performance metrics were calculated for binary classification: area under receiver operating characteristic curve (AUC), accuracy, sensitivity, and specificity. For multiclass (3-way) classification, micro-averaged AUC, accuracy, sensitivity, and specificity were calculated. The micro-average aggregated the contributions of all classes to compute the average metric, which is more preferable when dealing with multiclass classification.18 The 95% confidence intervals on accuracy, sensitivity, and specificity were calculated using the adjusted Wald method.19 The P values were calculated using the binomial test. A P value < .05 was considered statistically significant.
Code Availability
The implementation of the radiomics feature extraction was based on the “radiomics-develop” package from the Naqa Lab at McGill University.16 This code is available for public use on GitHub at https://github.com/mvallieres/radiomics-develop. The implementation of the machine learning models was based on the scikit-learn package of Python at https://github.com/scikit-learn/scikit-learn. The Auto-ML script used the TPOT package from the Epistasis Lab.17 This code is publicly available at https://github.com/subhanik1999/Radiomics-ML.
RESULTS
Patient Characteristics
A total of 288 patients with pediatric posterior fossa tumors (111 MBs, 70 EPs, and 107 PAs) were included in the study cohort. The mean age of all patients was 8.6 years, ranging from 0.25 to 18 years. The mean ages of patients with MB, EP, and PA were 9.0, 9.1, and 7.9 years, respectively (P = .291). There were 161 males and 127 females for the whole cohort. The sex ratio for each type of tumor (male/female) was 65:46, 36:34, and 60:47, respectively (P = .640).
Agreement of Segmentation
For each case in the study, the average required time for segmentation was about 10 minutes. The average intraclass correlation coefficient between the 2 segmenters was 0.91 for T2WI, 0.92 for the T1WI contrast-enhanced sequence, and 0.86 for ADC.
Multiclass Classification for 3 Tumors (MB versus EP versus PA)
For the TPOT pipeline, 10 separate models were generated for differentiation of the 3 tumor types. Overall, all 10 models showed a favorable micro-averaged AUC on the training set (On-line Table 4). Model 8 achieved the best performance with the highest micro-averaged AUC (0.93) among the 10 models. The parameters of all the TPOT models are described in detail in On-line Table 4. The top 20 important radiomics features are listed in On-line Table 5. In the testing cohort, the best model (model 8) achieved a micro-averaged AUC of 0.91 and an accuracy of 0.83 (95% CI, 0.72–0.90). The sensitivity and specificity of the diagnostic model for each type of tumor are shown in Table 1.
Performance of multiclass classification across all models and experts in test set
For manual expert optimization, micro-averaged AUC scores on the training set from each combination of feature-selection method and classifier are shown in On-line Fig 2. The combination of χ2 score (CHSQ) as the feature-selection method and the FSL General Linear Model (GLM; http://fsl.fmrib.ox.ac.uk/fsl/fslwiki/GLM) as the classifier achieved the highest micro-averaged AUC of 0.93 on the training set. As the top-performing model, CHSQ + GLM was then tested on the final test set and achieved a test micro-averaged AUC of 0.92 and accuracy of 0.74 (95% CI, 0.62–0.83). The sensitivity and specificity of the diagnostic model for each type of tumor are shown in Table 1. The top 20 important radiomics features used by the CHSQ + GLM model are shown in On-line Table 6.
Binary Classification
For the TPOT pipeline, 30 separate models were generated for the binary classification of MB versus non-MB, EP versus non-EP, and PA versus non-PA (10 models in each classification).
The performances of all the models on the training set are shown in On-line Table 7. Among all models, model 9 for MB versus non-MB, model 8 for EP versus non-EP, and model 7 for PA versus non-PA achieved the highest AUCs (0.97, 0.84, and 0.96 respectively). The parameters of all the TPOT models are described in detail in On-line Table 7. Then the best models were tested on the test set, and performances were as follows: For all 3 binary classifications, the AUC ranged from 0.84 to 0.94, accuracy ranged from 0.80 to 0.88, sensitivity ranged from 0.52 to 0.95, and specificity ranged from 0.81 to 0.93. The test performances for all 3 models are reported in detail in Table 2.
Performance of binary classification across all models and experts in the test set
For manual expert optimization, the AUC scores from each combination of feature-selection method and classifier are shown in On-line Figs 3–5. The combinations of feature-selection method and classifier that achieved the highest AUCs on the training set for the 3 different binary classifications are as follows: Relief + support vector machine (AUC = 0.97) for MB versus non-MB, joint mutual information + neural network (AUC = 0.79) for EP versus non-EP, and CHSQ + GLM (AUC = 0.96) for PA versus non-PA. The models Relief + support vector machine, joint mutual information + neural network, and CHSQ + GLM with the best performance on the training set above were then tested on the final testing set. For all 3 binary classifications and their optimal feature-selection method-classifier combination, the AUC ranged from 0.70 to 0.98, accuracy ranged from 0.71 to 0.91, sensitivity ranged from 0.19 to 0.96, and specificity ranged from 0.88 to 0.95. The test performances for all 3 models are reported in detail in Table 2.
Expert Evaluation
For multiclass classification, expert 1 had an overall test accuracy of 0.58 (95% CI, 0.46–0.69) with sensitivities of 0.50–0.65 and specificities of 0.67–0.86 across the 3 tumor types. Expert 2 achieved an overall test accuracy of 0.50 (95% CI, 0.38–0.62) along with sensitivities of 0.43–0.57 and specificities of 0.66–0.80 across the 3 tumor types (Table 1). For binary classification, expert 1 achieved a test accuracy of 0.67–0.74 and expert 2 achieved a test accuracy of 0.64–0.68 across the 3 binary classifications. The sensitivity and specificity of each group are shown in Table 2.
Comparison of Radiomics Model Performance with Expert Evaluation
For multiclass classification, the TPOT model achieved significantly higher test accuracy compared with average expert MR imaging review (accuracy, 0.83 versus 0.54; P < .001). The TPOT model also had higher accuracy than the CHSQ + GLM model by the manual expert optimized pipeline (accuracy, 0.83 versus 0.74), but this difference was not statistically significant (P = .160). For binary classification, the TPOT models shared similar performance with the models by manual expert optimized pipeline in the classification of MB versus non-MB (accuracy, 0.85 versus 0.91; P = .247), EP versus non-EP (accuracy, 0.80 versus 0.71; P = .333), and PA versus non-PA (accuracy, 0.88 versus 0.86; P = .385). The TPOT models outperformed average expert MR imaging review in the classification of MB versus non-MB (accuracy, 0.85 versus 0.66; P < .001), EP versus non-EP (accuracy, 0.80 versus 0.71; P = .177), and PA versus non-PA (accuracy, 0.88 versus 0.71; P = .002). The receiver operating characteristic curves of all radiomics models compared with expert evaluations are shown in Figs 2 and 3). On-line Figure 6 depicts examples of agreement or disagreement between the TPOT model and expert review in multiclass classification of pediatric posterior fossa tumors.

The receiver operating characteristic curves of the radiomic models compared with expert MR imaging evaluations in multiclass classification. Acc indicates accuracy.

The receiver operating characteristic curves of the radiomic models compared with expert MR imaging evaluations in the binary classification for medulloblastoma versus nonmedulloblastoma (A), ependymoma versus nonependymoma (B), and pilocytic astrocytoma versus non-pilocytic astrocytoma (C). RELF indicates Relief; acc, accuracy; SVM, support vector machine; Nnet, neural network; JMI, joint mutual information.
DISCUSSION
Qualitative MR imaging review is critical for tumor diagnosis and evaluation. However, it often offers limited information regarding tumor type because pediatric posterior fossa tumors share similar appearances across conventional modalities.20,21 Many studies have suggested that ADC maps may be accurate in the differentiation of these tumors. Parameters such as mean ADC, minimal ADC, and tumor/normal ADC ratio were studied and used as thresholds for discrimination.22⇓⇓⇓-26 However, studies have shown overlap of ADC values among the different posterior fossa tumor types.27,28 Several studies have also explored the integration of other advanced MR technologies, including MR spectroscopy and MR perfusion. However, these advanced MR imaging modalities are not used on a routine basis and vary in performance when discriminating the pediatric posterior fossa tumors.2,21
In a previous retrospective study of 40 pediatric posterior fossa tumors (17 MBs, 16 PAs, and 7 EPs) by Rodriguez et al,29 models using support vector machine–based classifiers and ADC histogram features were trained and achieved average correct classifications of 95.8%, 96.9%, and 94.3% on MB, PA, and EP, respectively. The subsequent joint classifier for 3 tumors achieved correct classification of 91.4%. However, a major limitation of this study is the small data size used for analysis. Despite the good performance in the training set, the final models were not tested on a separate dataset. Furthermore, the model performance can vary when using different classifiers during the process. In this study, the authors tested only 1 classifier (support vector machine), which may result in bias and the possibility of missing a model with better performance.
In our study, 288 patients with the most common pediatric posterior fossa tumor subtypes were included, and autoML via TPOT was used to train the diagnostic models based on the T1WI contrast-enhanced sequence, T2WI, and ADC maps. We also compared the models by the automated TPOT pipeline with models by the manual expert optimized pipeline selected by the training models with different combinations of 13 different feature-selection methods and 10 classifiers. Both pipeline-generation methods were trained and then tested on separate data. Overall, radiomics models based on the TPOT pipeline outperformed MR imaging review by qualitative experts. Although the difference is not statistically significant, the TPOT model achieved better performance than models built by the manual expert optimized pipeline. TPOT has delivered a promising predictive performance in many other studies, including genomics applications17 and clinical metabolic profiling,30 and was found to be quite accurate in predicting H3 K27M mutation in gliomas, with accuracy ranging from 0.60 to 0.84 in the testing cohort.31 In contrast to standard manual ML analysis, TPOT evaluates the complete pipelines of feature selection and classification on the basis of their cross-validated score (mean squared error or balanced accuracy) in addition to model selection and hyperparameter optimization.14 The automatic TPOT is a valuable tool for construction of an optimal radiomics model without the need for extensive manual testing by experts in ML. Given no prior knowledge about a problem, TPOT frequently outperforms standard manual ML analyses.17,32
During model construction, a well-known issue with regard to AutoML is “overfitting,” in which improper tuning during model selection occurs.14 AutoML is easily affected by the data size; therefore, a small data size could result in overfitting. In our study, 288 samples were included to avoid the issue of high variance. Another issue is data imbalance, which can lead to a biased analysis and results for machine learning. Our study included relatively balanced data from 3 groups (111 versus 70 versus 107) and thus reduced the effect of this issue.
Despite the robustness of these results, the classification scheme in the present study does not obviate tumor diagnosis by histopathology, the criterion standard. Histopathology is needed for a truly confirmatory diagnosis, offers the opportunity to profile nontumor cells in the tumor mass that play an important role in the pathogenesis of these malignancies,33 and classifies tumors into molecular subgroups that are not appreciated by imaging. In an era of personalized medicine and therapeutic approaches like immunotherapy, these factors are especially important. However, we anticipate that the MR imaging–based classification scheme of this study may improve clinical care for pediatric posterior fossa tumors in several potential ways. First, an initial imaging-based classification may function as a noninvasive method to plan a surgical approach and resection extent, even before the invasive biopsy required for histopathology has occurred.29 Second, an earlier indication of a pediatric patient’s potential tumor subtype may expedite the planning of any potential neoadjuvant therapy.34 Third, the imaging features identified herein may complement, rather than replace, histopathology in the case of diagnosing pediatric fossa tumors with more complex histopathologic features.
There are several possible improvements to our study. First, there can be selection bias for our study because the patients were identified via a search of the pathology data base. Second, future studies can include advanced imaging modalities such as MR spectroscopy and MR perfusion, which may further improve model performance. However, adding these advanced MR images is also a limitation in that these sequences may not be available at every institution. Third, the criterion standard for comparisons was the diagnosis indicated on the final pathology report. Consensus reads by multiple pathologists were not performed due to challenges, including resource constraints and the multi-institutional nature of the study dataset. In addition, we were unable to analyze less frequent pediatric posterior fossa tumors such as atypical teratoid/rhabdoid tumor, hemangioblastoma, and diffuse midline gliomas due to their low sample size in our study cohort and the aforementioned risk of model overfitting. A similar methodology to the present study and a larger multi-institutional cohort may facilitate the future incorporation of these subtypes into our MR imaging–based classification schema. Finally, although there is a good likelihood of achieving greater performance by experts with Certificates of Added Qualification in pediatric neuroradiology, this comparison was unfortunately unable to be facilitated in the present study due to differences in standard practices around the world. As a point of reference, earlier studies have documented human accuracy of pediatric brain tumor classification as approximately between 70% and 80% by pediatric neuroradiologists with Certificates of Added Qualification.35,36
CONCLUSIONS
AutoML of TPOT based on conventional MR imaging can classify pediatric posterior fossa tumors with high accuracy compared with the manual expert optimized pipeline and expert radiologists.
Footnotes
This work was supported by National Natural Science Foundation of China grant under award No. 8181101287 to H. Bai; the National Natural Science Foundation of China (No. 61702559); the 111 project under grant No. B18059; the Planned Science and Technology Project of Hunan Province, China (No. 2017WK2074) to Chengzhang Zhu; the National Natural Science Foundation of China (81301988 to Li Yang); the Natural Science Foundation of Hunan Province for Young Scientists, China (grant No: 2018JJ3709 to Li Yang) and the National Science and Technology Major Project (No. 2018AAA0102102) to Beiji Zou.
Disclosures: Ken Chang—RELATED: Grant: National Institutes of Health, Comments: Research reported in this publication was supported by a training grant from the National Institute of Biomedical Imaging and Bioengineering of the National Institutes of Health under award number 5T32EB1680 and by the National Cancer Institute of the National Institutes of Health under award No. F30CA239407 to K. Chang. Raymond Y. Huang—UNRELATED: Grants/Grants Pending: research grant from Agios Pharmaceuticals.* Li Yang—RELATED: Grant: Natural Science Foundation of China/Natural Science Foundation of Hunan Province for Young Scientists, China, Comments: This funding came from a government granting agency.* *Money paid to the institution.
Indicates open access to non-subscribers at www.ajnr.org
References
- Received November 30, 2019.
- Accepted after revision April 30, 2020.
- © 2020 by American Journal of Neuroradiology


