
Abstract
BACKGROUND AND PURPOSE: The detection of cervical nodal metastases is important for the prognosis and treatment of head and neck tumors. The purpose of this study was to assess the ability of ADC values at 3T to distinguish malignant from benign lymph nodes.
MATERIALS AND METHODS: From July 2009 to June 2010, twenty-two patients (21 men and 1 woman; mean age, 49.8 ± 9.5 years; age range, 28–66 years) scheduled for surgical treatment of biopsy-proved head and neck cancer were prospectively and consecutively enrolled in this study. All patients were scanned on a 3T imaging unit (Verio) by using a 12-channel head coil combined with a 4-channel neck coil. Histologic findings were the reference standard for the diagnosis of lymph node metastasis.
RESULTS: The ADC values derived from the signal intensity averaged across images obtained with b-values of 0 and 800 s/mm2 were 1.086 ± 0.222 × 10⁻³ mm2/s for benign lymph nodes and 0.705 ± 0.118 × 10⁻³ mm2/s for malignant lymph nodes (P < .0001). When an ADC value of 0.851 × 10⁻³ mm2/s was used as a threshold value for differentiating benign from malignant lymph nodes, the best results were obtained with an accuracy of 91.0%, sensitivity of 91.3%, and specificity of 91.1%.
CONCLUSIONS: The ADC value is a sensitive and specific parameter that can help to differentiate malignant from benign lymph nodes.
ABBREVIATIONS:
- AUC
- area under the ROC curve
- ROC
- receiver operating characteristic analysis
Nodal metastases are an adverse prognostic factor in patients with head and neck cancer, and accurate detection can help optimize treatment.1 Anatomic imaging with CT and MR imaging is well-established in the initial diagnostic evaluation of head and neck malignancy and is widely used for treatment planning and monitoring and for posttreatment follow-up.2 On anatomic CT and MR images, certain parameters (shape, size, internal architecture, extracapsular extension, and vascular features) are associated with lymph node metastasis, but accuracy is limited, particularly in normal-sized non-necrotic lymph nodes.3
Cancer metastasis to the regional lymph nodes may be associated with alteration in water diffusivity and microcirculation of the nodes.4 DWI, based on intravoxel incoherent motion imaging that allows visualization of molecular diffusion and microcirculation of the blood in the capillary network of biologic tissues is an MR imaging technique that shows the potential for more specific characterization of lesions. The use of DWI to distinguish malignant from benign cervical nodes has been reported in several studies.4⇓⇓⇓–8 All of these studies used 1.5T MR imaging to investigate head and neck nodal lesions and extract ADC values from DWI. After the introduction of 3T MR imaging, ADC values obtained with 3T MR imaging were used to differentiate malignant and benign head and neck cancers,9 but not to investigate head and neck lymph nodes. The purpose of this study was to assess whether ADC values from 3T MR imaging could distinguish malignant from benign cervical lymph nodes.
Materials and Methods
Patients
This study was approved by the local institutional review committee. All patients gave their informed consent before MR imaging examinations. From July 2009 to June 2010, thirty-two patients who were scheduled for surgical treatment of biopsy-proved head and neck cancer were prospectively enrolled in this study. MR imaging was then performed on these patients before they underwent surgical neck dissection. Ten patients were excluded from the study cohort: 1) four patients whose images had motion artifacts, 2) three patients whose treatment changed to nonsurgical treatment, and 3) three patients who had surgical excision of neck nodes before MR imaging because of changes in disease status.
The remaining 22 patients (21 men and 1 woman; mean age, 49.8 ± 9.5 years; age range, 28–66 years) underwent combined conventional TSE MR imaging and DWI before undergoing surgery to remove tumors and lymph nodes. The final diagnosis was based on pathologic findings in surgical resection specimens.
The tumor stage was determined according to the size of the tumor, the muscle invasion, and the involvement of adjacent structures as per the American Joint Committee on Cancer staging system.10
MR Imaging Technique
All MR imaging studies were performed by using a 3T imaging unit (Verio; Siemens, Erlangen, Germany) with a 12-channel head coil combined with a 4-channel neck coil. During MR imaging sequences, patients were instructed to hold still and not to swallow to avoid motion artifacts.
The following protocols were used in all patients. Before contrast administration, the patients underwent 3 scanning sequences: 1) transverse T2-weighted TSE MR imaging (TR/TE, 3500/88 ms; section thickness, 3 mm; FOV, 230 mm; intersection gap, 0.9 mm; image matrix, 314 × 448; number of signals acquired, 1); 2) transverse T1-weighted TSE MR imaging (TR/TE, 700/10 ms; section thickness, 3 mm; FOV, 230 mm; intersection gap, 0.9 mm; image matrix, 314 × 448; number of signals acquired, 1); 3) DWI of the head and neck in the transverse plane by using a spin-echo single-shot echo-planar imaging sequence (TR/TE, 8000/77 ms; section thickness, 3 mm; intersection gap, 0.9 mm; FOV, 230 mm; image matrix, 122 × 144; number of signals acquired, 3). DWI images were obtained at b factors of 0 and 800 s/mm2 for eachsection in the same sequence.8 The scan range was from the skull base to the suprasternal notch. The ADC maps were then automatically reconstructed on the scanner console.
After a bolus injection of 0.1 mmol/kg of gadodiamide (Omniscan; GE Healthcare, Cork, Ireland), the patients underwent 1 scanning sequence: transverse fat-suppressed T1-weighted TSE MR imaging (TR/TE, 700/10 ms; section thickness, 3 mm; FOV, 230 mm; intersection gap, 0.9 mm; image matrix, 314 × 448; number of signals acquired, 1).
Image Analysis
One radiologist (C.-K.L.) with 6 years of experience in MR imaging of the head and neck region interpreted MR images on the basis of T2- and T1-weighted images. A lymph node was considered to be metastatic on the basis of the nodal size, contour irregularity, or heterogeneous contrast enhancement.5 The sizes of all lymph nodes were measured by the radiologist (C.-K.L.) in their minimal transverse diameter. The nodal size criteria larger than 2 mm were used.11
The DWI ADC maps were automatically reconstructed by standard software on the scanner console. The region-of-interest position was based on the T2- and T1-weighted contrast-enhanced MR images and was directly drawn on the ADC map for each node by a radiologist (C.-K.L.). Region-of-interest measurements in the lymph nodes included the largest solid component and excluded obviously necrotic or cystic regions.7,12 The ADC value was then obtained from the ADC maps. All lymph nodes seen on DWI images were proceeded ADC calculation except lymph node diameters less than region-of-interest extent.
The nodal stage was determined according to the size, number, and location of the lymph nodes by preoperative MR images.
Pathologic Evaluation
Histologic findings from surgical resection were the reference standard for primary tumor metastasis to the lymph nodes. Surgeons carefully reviewed MR images on the PACS, and intraoperatively, the specimens were matched with the lymph nodes as imaged on T2- and T1-weighted contrast-enhanced MR images. To ensure that the node removed surgically during neck dissection was the same node seen at MR imaging, the lymph nodes were excised adjacent to reference structures to determine the relationship between the excised nodes and the surrounding structures. After surgery, each node was carefully delineated and tagged for pathologic diagnosis. The histopathologic and radiologic findings were correlated on an individual nodal basis.
After the histopathologic and radiologic findings for each lymph node were correlated, the optimal ADCb=0-800 threshold for differentiating malignant from benign lymph nodes was determined by using ROC analysis.5 The sensitivity and specificity of the DWI method were then calculated.
For pathologic metastatic lymph nodes, the ratio of intranodal tumor deposits was measured by an experienced pathologist according to the lymph node size (short-axis diameter) and the size of intranodal tumor deposits (maximum diameter of metastatic foci in each lymph node).
Statistical Analysis
Statistical analyses were performed by using statistical software MedCalc for Windows (Version 9.4; MedCalc Software, Mariakerke, Belgium). Numeric data are reported as means ± SD. A box-and-whisker plot was used to depict the scatterplot of mean ADC values in benign and malignant lymph nodes. The ROC curve was performed to evaluate the diagnostic capability of the ADC value and to determine the cutoff values for differentiating malignant from benign lymph nodes.
The AUC was used to measure the performance of using the ADC values as effective indicators for discrimination. An independent-sample t test was used to compare the mean diameters of the benign and malignant lymph nodes.
Results
A total of 169 cervical lymph nodes were detected in 22 untreated patients (21 men and 1 woman; mean age, 49.8 ± 9.5 years; age range, 28–66 years). There were 17 patients with unilateral neck dissection and 5 patients with bilateral neck dissection. The specimens were divided into level I to level V, and then resected lymph nodes were carefully matched with MR images and pathologic evaluation. The location and clinical tumor stage were based on physical examinations and preoperative MR images. The nodal stage was determined by the conventional TSE MR images, DWI images, and histopathology for each patient. The tumor stages and nodal stages are shown in Table 1. Of 169 cervical lymph nodes, 146 were benign and 23 were malignant. The sizes of 23 malignant lymph nodes ranged from 0.36 to 1.84 cm (in minimal transverse diameter), and ADC values ranged from 0.437 to 0.884 10−3 mm2/s (Table 2). The box-and-whisker plot (Fig 1) presents the distribution of mean ADC values in benign and malignant lymph nodes. All lymph nodes were placed in 1 of 2 groups according to their diameters: supracentimeter (n = 58) or subcentimeter (n = 111) lymph nodes. The mean ADC values for the benign and malignant lesions were 1.086 ± 0.222 and 0.705 ± 0.118 × 10⁻³ mm2/s for all lymph nodes, 1.076 ± 0.238 and 0.705 ± 0.141 × 10⁻³ mm2/s for subcentimeter lymph nodes, and 1.105 ± 0.188 and 0.705 ± 0.077 × 10⁻³ mm2/s for supracentimeter lymph nodes. The detailed data are summarized in Table 3.
Tumor location, clinical tumor stages, and nodal stages according to TSE MR imaging, histopathology, and DWI
3T ADC values in malignant neck lymph nodes

Box-and-whisker plot presenting the scatterplot of mean apparent diffusion coefficients in all lymph nodes and subcentimeter and supracentimeter lymph nodes.
ADC value based on supracentimeter and subcentimeter lymph node size
Figure 2 shows corresponding ROC curves of ADC values used for differentiating malignant from benign lymph nodes (P < .0001). Patients with hypopharynx squamous cell carcinoma who had supracentimeter and subcentimeter metastatic lymph nodes are shown in Figs 3 and 4, respectively.

ROC curves were created for all lymph nodes and subcentimeter and supracentimeter lymph nodes. The cutoff ADC values were 0.851 × 10⁻³ mm2/s, 0.884 × 10⁻³ mm2/s, and 0.851 × 10⁻³ mm2/s for all lymph nodes and subcentimeter and supracentimeter lymph nodes and were used to differentiate malignant from benign lymph nodes. The best results obtained were sensitivities of 91.3%, 100%, and 100%, specificities of 91.1%, 80.4%, and 91.8%, respectively. The areas under the curve were 0.97, 0.96, and 0.99.

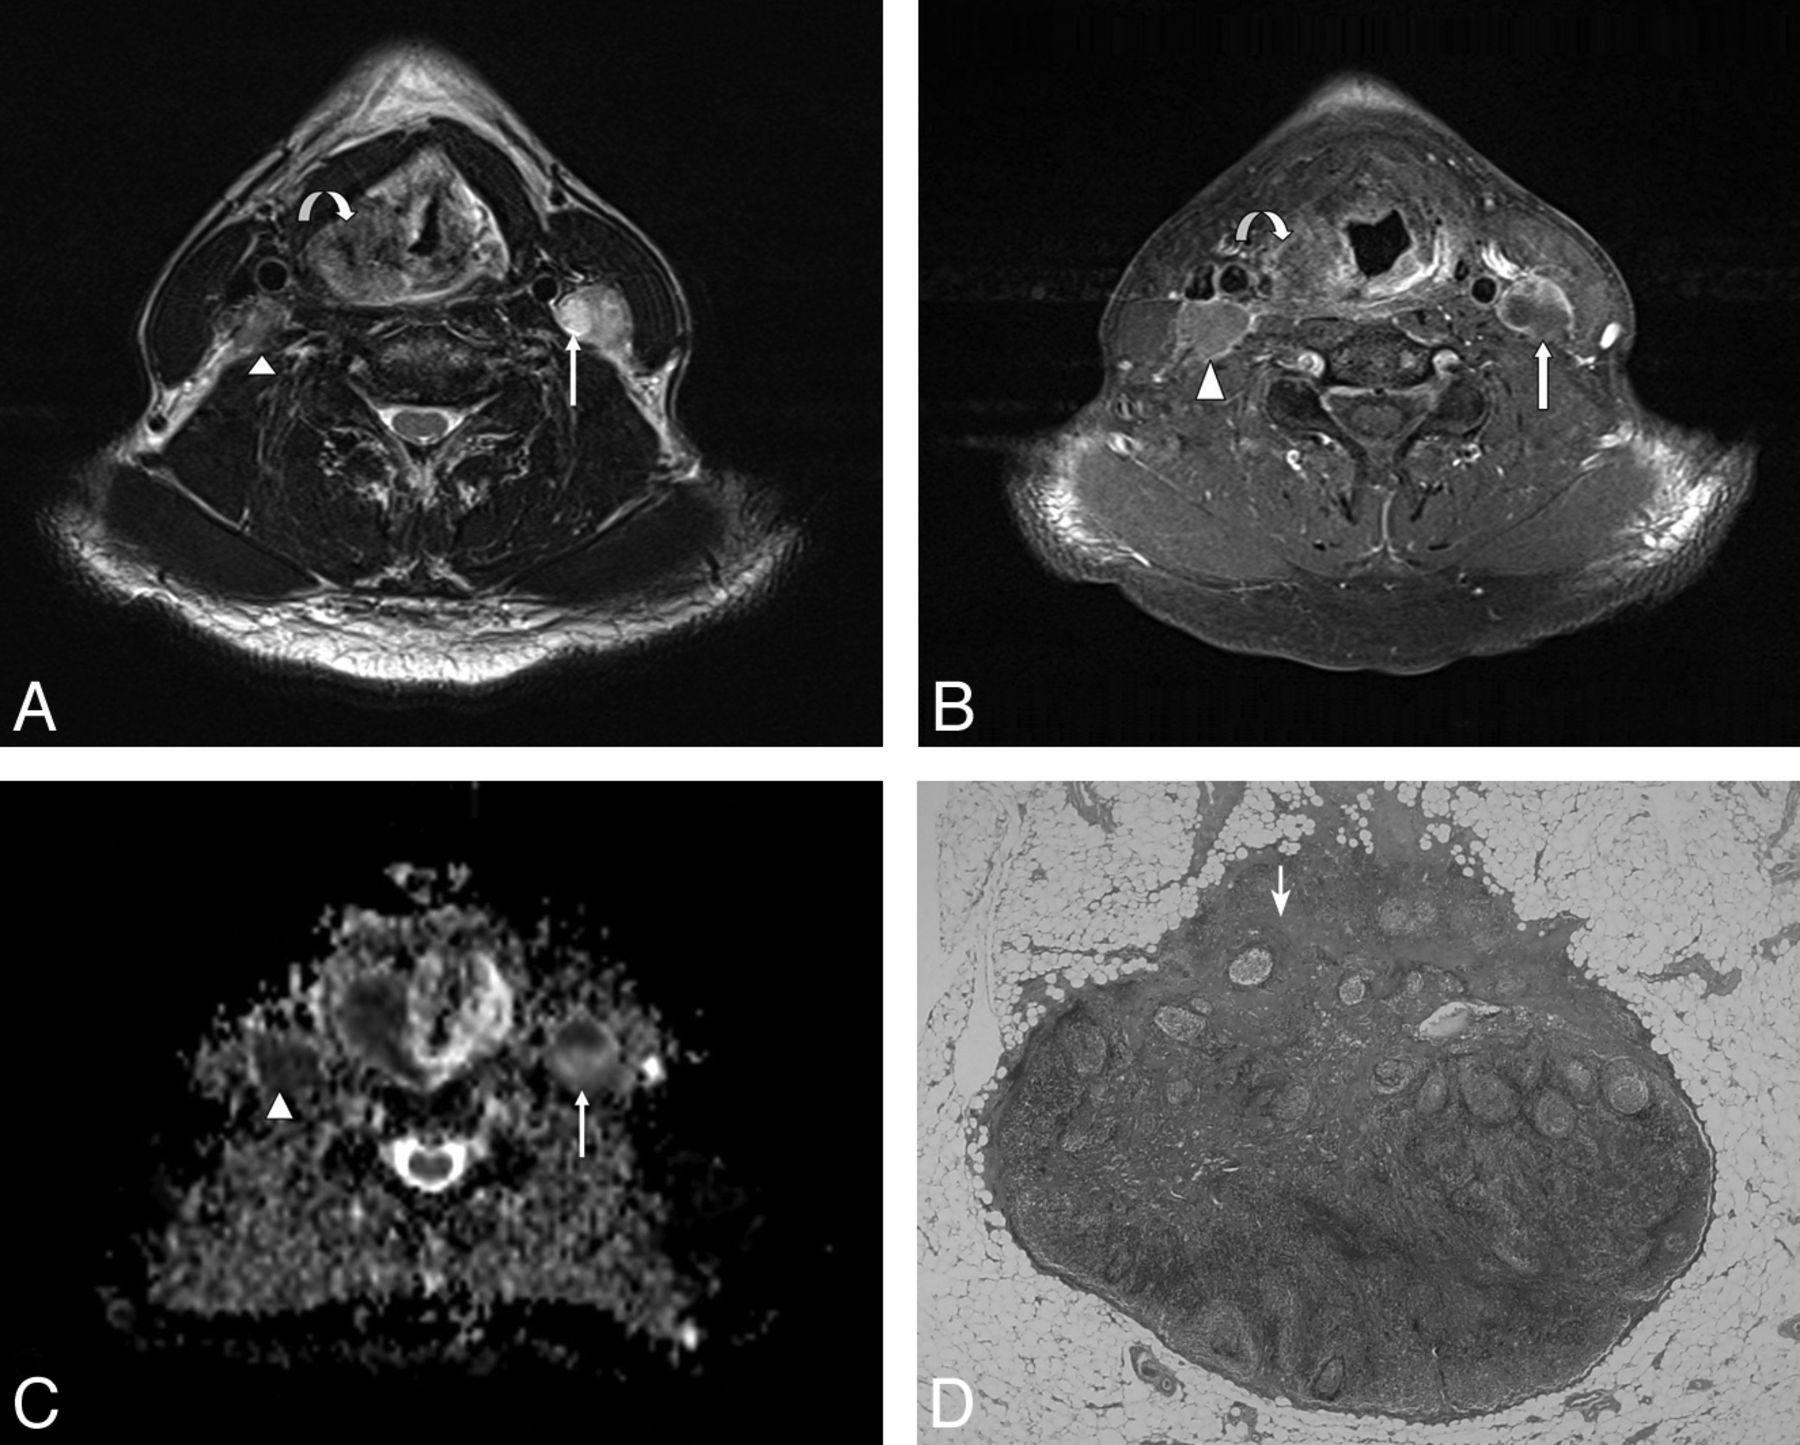
A 60-year-old male patient with pathologically proved squamous cell carcinoma of the hypopharynx. A, The axial T2-weighted MR image shows an infiltrative neoplasm in the right pyriform apex of the hypopharynx (curved arrow) and enlarged lymph nodes in the bilateral level III, showing heterogeneous signal intensity (arrow and arrowhead). B, The axial postgadolinium fat-suppressed T1-weighted FSE image reveals mild peripheral enhancement in the right pyriform apex tumor (curved arrow) and heterogeneous enhancement in bilateral level III lymph nodes (arrow and arrowhead). C, The ADC value within the right level III lymph node measured 0.712 × 10⁻³ mm2/s (arrowhead), and the left level III lymph node measured 0.659 × 10⁻³ mm2/s (arrow). D, Corresponding H&E-stained histopathologic slide shows intranodal tumor cell metastasis (arrow) (original magnification, ×20).

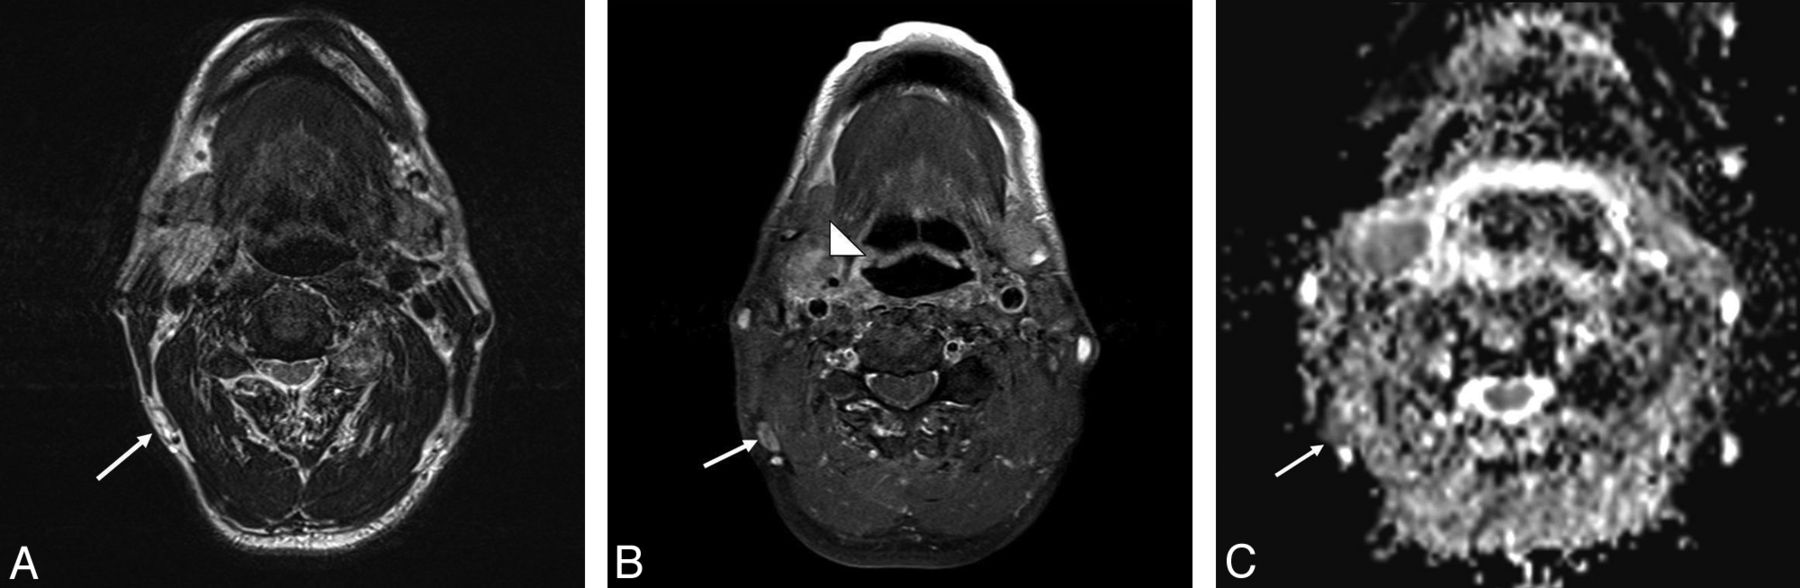
A 59-year-old male patient with pathologically proved squamous cell carcinoma of the hypopharynx and metastatic lymphadenopathy of the right level V lymph nodes. A, The axial T2-weighted MR image shows a subcentimeter lymph node with high signal intensity at right level V (arrow). B, The axial postgadolinium fat-suppressed T1-weighted image reveals moderate enhancement in the right pyriform apex tumor (arrowhead) and heterogeneous enhancement in the right level V lymph nodes (arrow). C, The ADC value was 0.811 × 10⁻³ mm2/s (arrow) in the right level V lymph node.
One patient (Table 1, patient 19) with pathologically proved squamous cell carcinoma of the right tongue had a right level I lymph node metastasis. Conventional TSE MR images showed a normal regular contour, a minimal transverse diameter of 0.55 cm, and homogeneous enhancement. The DWI ADC value was lower than the cutoff value though, representing malignancy (Fig. 5).

A 28-year-old female patient with pathologically proved squamous cell carcinoma of the right tongue body with right level I lymph node metastasis. A, The axial T2-weighted MR image shows no necrotic change of the right level I lymph node (arrow). B, The axial T1-weighted MR image shows normal configuration and size of the right level I lymph node with fatty content in its hilar region (arrow). C, The axial postgadolinium fat-suppressed T1-weighted FSE image reveals homogeneous enhancement of the right level I lymph node (arrow). D, The ADC value within the right level I lymph node measured 0.839 × 10⁻³ mm2/s (arrow).
The mean diameters of the benign and malignant lymph nodes were 0.89 ± 0.38 cm (range, 0.27–2.89 cm) and 0.98 ± 0.46 cm (range, 0.36–1.84 cm), respectively. Although the mean diameter of the malignant lymph nodes was slightly greater than that of the benign lymph nodes, comparison of the groups of benign and malignant nodes by using an independent-samples t test revealed that the difference did not reach statistical significance (P = .192).
The conventional TSE MR imaging findings based on morphology and size were correlated with pathologic findings for each patient. The sensitivity and specificity of conventional TSE MR imaging findings to detect malignant nodal involvement were 87.5% and 57.1%, respectively. The mean percentage of the tumor deposit within the affected nodes measured by a pathologist was 74.3% ± 30.2%.
Discussion
Differentiation of benign from malignant nodes is essential for tumor staging, treatment planning, prognostication, and follow-up both during and after treatment. Diffusion imaging enables characterization of tissue at a microscopic level, emphasizing a mechanism that is different from T1 and T2 relaxation13,14 and potentially improving the performance of MR imaging.13,15,16
Differences in ADC values between benign and malignant processes of the head and neck have been demonstrated in several studies.4⇓⇓⇓⇓–9,12,13,17⇓–19 The On-line Table summarizes the studies that have investigated head and neck lesions with 1.5T or 3T MR imaging. These studies determined the cutoff ADC values for differentiating malignant from benign head and neck cancers or lymph nodes. For example, Srinivasan et al9 used 3T MR imaging to determine an ADC cutoff value of 1.3 × 10⁻³ mm2/s for differentiating malignant (1.071 ± 0.293 × 10⁻³ mm2/s) from benign (1.505 ± 0.487 × 10⁻³ mm2/s) head and neck tumors.
Previous studies4⇓⇓⇓–8 investigated neck lymph nodes at 1.5T. The cutoff values were from 0.94 to 1.38 × 10⁻³ mm2/s.5⇓–7 Mean ADC values for benign (1.19 to 1.64 × 10⁻³ mm2/s) were higher than malignant (0.85 to 1.09 × 10⁻³mm2/s) lymph nodes. Sumi et al,4 however, found that metastatic nodes (0.410 ± 0.105 × 10⁻³ mm2/s) had higher ADC values than benign nodes (0.302 ± 0.062 × 10⁻³ mm2/s). These differences cannot be attributed solely to the different b-value setting for ADC calculations. The higher number of necrotic metastatic lymph nodes included in the Sumi et al study may have contributed to the discrepancy.4 In our study, the ADC cutoff value (0.851 × 10⁻³ mm2/s) is lower than the values found in other studies5⇓–7 for the detection of malignant head and neck lymph nodes. The ADC value is calculated by the equation, ADC = ln (SI1 / SI2) / b2 − b1, where SI1 is the signal intensity when the b1 value is 0, and SI2 is the signal intensity when the b2 value is 800. The other studies used b-values of 0 and 1000, a much higher b2 factor than that in our study. According to the equation, the ADC value for b = 0–1000 is higher than the value for b = 0–800 because of the signal loss in DWI with the increasing b-value.20 Different MR imaging units may also have different ranges of ADC values as shown in the On-line Table.
In our study, the mean ADC values of benign lymph nodes were higher than the provided cutoff ADC value (Fig 1). However, some benign lymph node ADC values were lower than the cutoff value. Perrone et al7 indicated that the ADC values of benign lymph nodes in patients with tuberculosis are lower than the cutoff value, for example, for the malignant group. In future studies, a larger number of cases should be included to clarify the correlation between the ADC values of benign lymph nodes that are lower than the cutoff value and histopathologic findings.
DWI ADC calculation and ROC analysis (all lymph nodes, subcentimeter, and supracentimeter) presented higher sensitivity and specificity than conventional TSE MR imaging findings.
The size of the node and the size of intranodal tumor deposits varied widely in affected lymph nodes in the study of Ng et al.21 They showed that the mean percentage of tumor deposit within the affected nodes was 69.31% ± 27.7%, which is similar to the result (74.3% ± 30.2%) in our study. Previous studies22,23 indicated that there was a strong correlation between the intranodal tumor deposit and the size of the metastatic lymph node.24 This supports the use of nodal size as an index to evaluate preoperative nodal metastasis, but it remains a nonspecific feature of tumor-involved lymph nodes.
A potential problem of using the ADC cutoff value to distinguish malignant lymph nodes was that metastatic nodes with necrotic areas might have higher ADC values due to necrosis and might be incorrectly identified as benign. To avoid this bias, we calculated the ADC value from the region of interest drawn on the solid part of lymph nodes.
Conclusions
A cutoff ADC value of 0.851 × 10⁻³ mm2/s best differentiated malignant from benign lymph nodes on 3T MR imaging in the setting of head and neck cancer, with 91.3% sensitivity and 91.1% specificity to detect tumor-involved lymph nodes. Adding DWI to routine MR imaging neck protocols is suggested because it may provide useful information. The results in our study can be used as reference values for studies investigating head and neck lymph nodes by using 3T MR imaging.
Footnotes
Ming-Che Lee and Hui-Yu Tsai contributed equally to this work.
References
- Received August 26, 2011.
- Accepted after revision June 23, 2012.
- © 2013 by American Journal of Neuroradiology
In this issue


Jump to section
Related Articles
Cited By...
- ADC for Differentiation between Posttreatment Changes and Recurrence in Head and Neck Cancer: A Systematic Review and Meta-analysis
- The Diagnostic Value of Diffusion-Weighted Imaging in Differentiating Metastatic Lymph Nodes of Head and Neck Squamous Cell Carcinoma: A Systematic Review and Meta-Analysis