Advertisement

Main menu

  • Home
  • Content
    • Current Issue
    • Accepted Manuscripts
    • Article Preview
    • Past Issue Archive
    • Video Articles
    • AJNR Case Collection
    • Case of the Week Archive
    • Case of the Month Archive
    • Classic Case Archive
  • Special Collections
    • AJNR Awards
    • Low-Field MRI
    • Alzheimer Disease
    • ASNR Foundation Special Collection
    • Photon-Counting CT
    • View All
  • Multimedia
    • AJNR Podcasts
    • AJNR SCANtastic
    • Trainee Corner
    • MRI Safety Corner
    • Imaging Protocols
  • For Authors
    • Submit a Manuscript
    • Submit a Video Article
    • Submit an eLetter to the Editor/Response
    • Manuscript Submission Guidelines
    • Statistical Tips
    • Fast Publishing of Accepted Manuscripts
    • Graphical Abstract Preparation
    • Imaging Protocol Submission
    • Author Policies
  • About Us
    • About AJNR
    • Editorial Board
    • Editorial Board Alumni
  • More
    • Become a Reviewer/Academy of Reviewers
    • Subscribers
    • Permissions
    • Alerts
    • Feedback
    • Advertisers
    • ASNR Home

User menu

  • Alerts
  • Log in

Search

  • Advanced search
American Journal of Neuroradiology

American Journal of Neuroradiology

ASHNR American Society of Functional Neuroradiology ASHNR American Society of Pediatric Neuroradiology ASSR
  • Alerts
  • Log in

Advanced Search

  • Home
  • Content
    • Current Issue
    • Accepted Manuscripts
    • Article Preview
    • Past Issue Archive
    • Video Articles
    • AJNR Case Collection
    • Case of the Week Archive
    • Case of the Month Archive
    • Classic Case Archive
  • Special Collections
    • AJNR Awards
    • Low-Field MRI
    • Alzheimer Disease
    • ASNR Foundation Special Collection
    • Photon-Counting CT
    • View All
  • Multimedia
    • AJNR Podcasts
    • AJNR SCANtastic
    • Trainee Corner
    • MRI Safety Corner
    • Imaging Protocols
  • For Authors
    • Submit a Manuscript
    • Submit a Video Article
    • Submit an eLetter to the Editor/Response
    • Manuscript Submission Guidelines
    • Statistical Tips
    • Fast Publishing of Accepted Manuscripts
    • Graphical Abstract Preparation
    • Imaging Protocol Submission
    • Author Policies
  • About Us
    • About AJNR
    • Editorial Board
    • Editorial Board Alumni
  • More
    • Become a Reviewer/Academy of Reviewers
    • Subscribers
    • Permissions
    • Alerts
    • Feedback
    • Advertisers
    • ASNR Home
  • Follow AJNR on Twitter
  • Visit AJNR on Facebook
  • Follow AJNR on Instagram
  • Join AJNR on LinkedIn
  • RSS Feeds

AJNR Awards, New Junior Editors, and more. Read the latest AJNR updates

Getting new auth cookie, if you see this message a lot, tell someone!
Research ArticleBrain

Radial Width of the Temporal Horn: A Sensitive Measure in Alzheimer Disease

Giovanni B. Frisoni, Cristina Geroldi, Alberto Beltramello, Angelo Bianchetti, Giuliano Binetti, Giovanni Bordiga, Charles DeCarli, Mikko P. Laakso, Hilkka Soininen, Cristina Testa, Orazio Zanetti and Marco Trabucchi
American Journal of Neuroradiology January 2002, 23 (1) 35-47;
Giovanni B. Frisoni
  • Find this author on Google Scholar
  • Find this author on PubMed
  • Search for this author on this site
Cristina Geroldi
  • Find this author on Google Scholar
  • Find this author on PubMed
  • Search for this author on this site
Alberto Beltramello
  • Find this author on Google Scholar
  • Find this author on PubMed
  • Search for this author on this site
Angelo Bianchetti
  • Find this author on Google Scholar
  • Find this author on PubMed
  • Search for this author on this site
Giuliano Binetti
  • Find this author on Google Scholar
  • Find this author on PubMed
  • Search for this author on this site
Giovanni Bordiga
  • Find this author on Google Scholar
  • Find this author on PubMed
  • Search for this author on this site
Charles DeCarli
  • Find this author on Google Scholar
  • Find this author on PubMed
  • Search for this author on this site
Mikko P. Laakso
  • Find this author on Google Scholar
  • Find this author on PubMed
  • Search for this author on this site
Hilkka Soininen
  • Find this author on Google Scholar
  • Find this author on PubMed
  • Search for this author on this site
Cristina Testa
  • Find this author on Google Scholar
  • Find this author on PubMed
  • Search for this author on this site
Orazio Zanetti
  • Find this author on Google Scholar
  • Find this author on PubMed
  • Search for this author on this site
Marco Trabucchi
  • Find this author on Google Scholar
  • Find this author on PubMed
  • Search for this author on this site
  • Article
  • Figures & Data
  • Info & Metrics
  • Responses
  • References
  • PDF
Loading

Article Figures & Data

Figures

  • Tables
  • Fig 1.
    • Download figure
    • Open in new tab
    • Download powerpoint
    Fig 1.

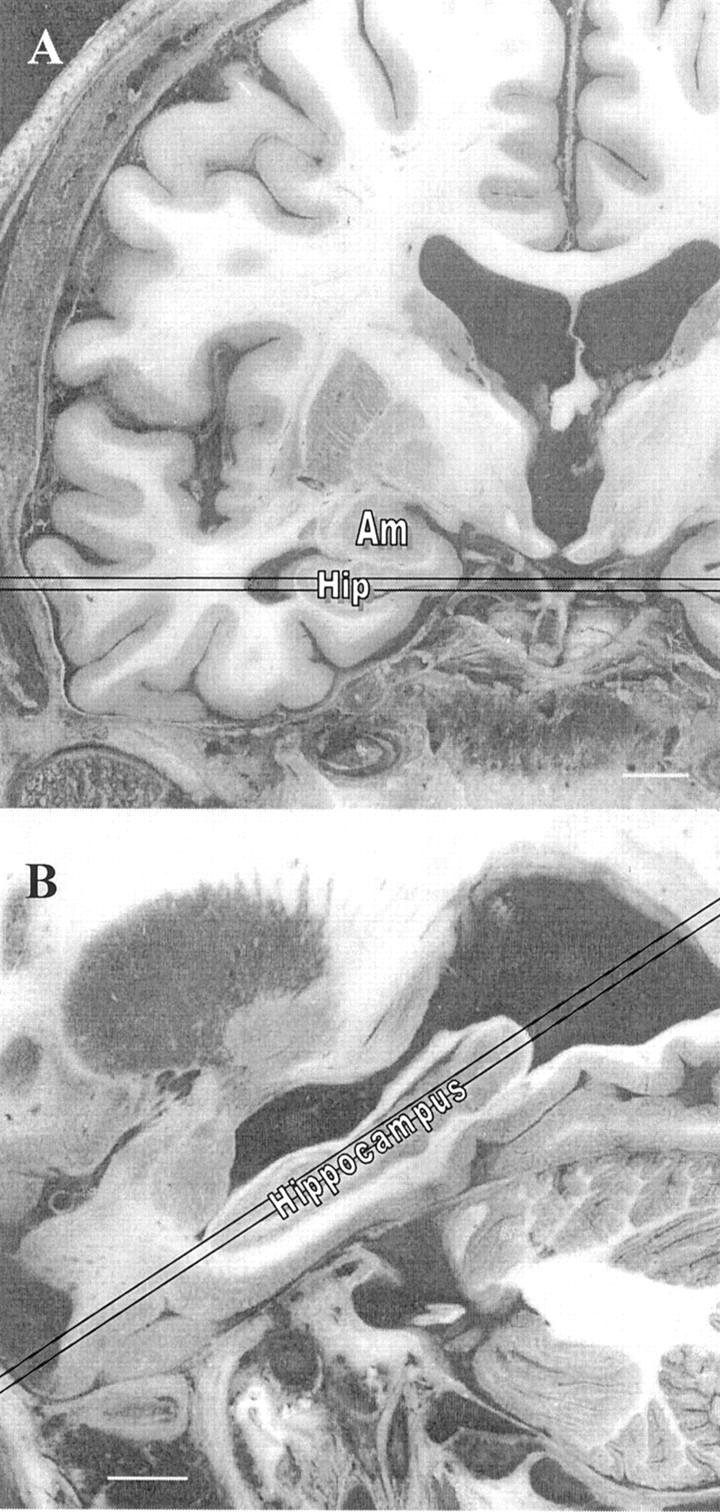
    Gross pathologic coronal (A) and axial (B) images showing the 2-mm section where the rWTH should be measured. Note.—Am indicates amygdala; hip, hippocampus. Bar = 10 mm. Adapted from Duvernoy, 1998 (54).

  • Fig 2.
    • Download figure
    • Open in new tab
    • Download powerpoint
    Fig 2.

    CT scans chosen for rWTH measures. Represented are eight contiguous 2-mm-thick sections spanning the whole caudal-to-rostral extension of the temporal horns of a patient with AD. The scans in which the right and left horns can be appreciated in their full length are C and D, and these are chosen for the measurements. Parallel lines are drawn tangentially to the tip of the temporal horns where the width is maximum (arrows).

  • Fig 3.
    • Download figure
    • Open in new tab
    • Download powerpoint
    Fig 3.

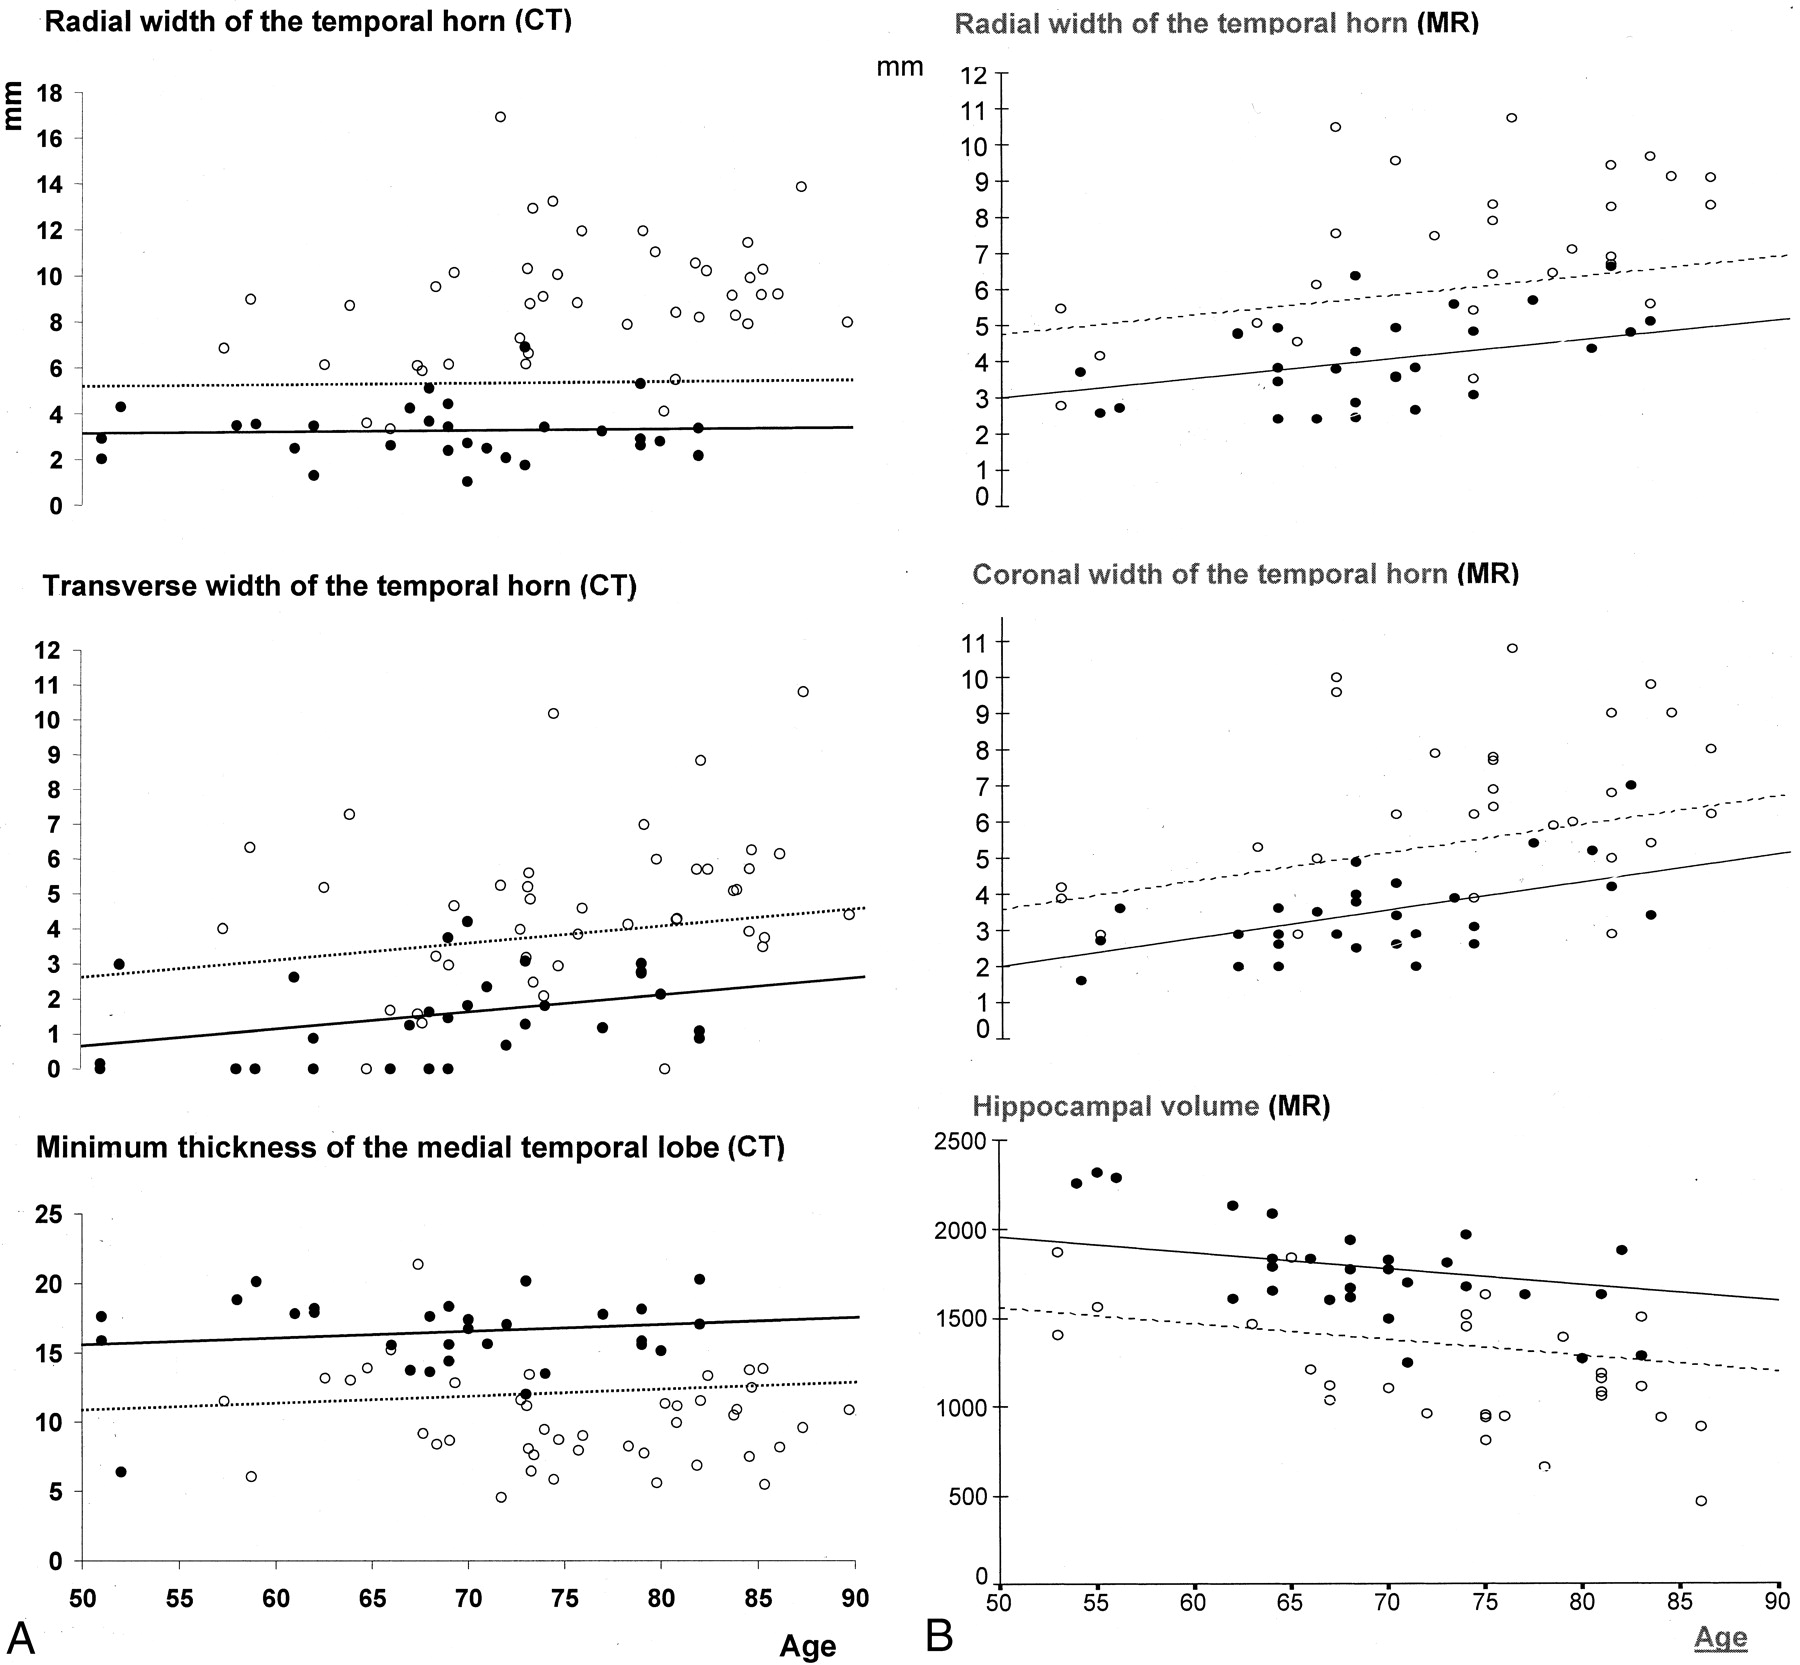
    Known-group validity of CT- (left) and MR-based (right) rWTH measures compared with that of other CT- and MR-based linear and volumetric measures of MTL atrophy in patients with AD (open circles) and control subjects (solid circles). Solid lines represent regression lines of the measures on age in control subjects. Dotted lines represent age-specific cutoffs that correctly classify 95% of control subjects.

Tables

  • Figures
    • View popup
    TABLE 1:

    Baseline characteristics of the CT study group

    Baseline CharacteristicsControl Group (n = 29)AD Group (n = 42)P value*
    Sociodemographics and anthropometrics
     Mean age at observation ± SD (y)69 ± 976 ± 8.0007
      (range)(51–82)(57–90)
     Women19 (65%)33 (75%)NS
     Mean education ± SD (y)9.4 ± 4.96.0 ± 3.3.001
      (range)(2–18)(2–17)
     Mean head size on axial plane ± SD, cm2136 ± 12138 ± 12NS
      (range)(115–164)(117–166)
    Dementia-related variables
     MMSE score†27.0 ± 0.921.1 ± 2.3<.0001
      (range)(23.4–27.4)(18–27)
     CDR of 0/.5/1/2 or 329/0/0/00/18/24/0<.0001
     Mean disease duration ± SD (mo)—37 ± 20
      (range)—(9–96)
     ApoE ε4 allele‡8/56 (14%)32/82 (39%).003
     Lacunes9 (33%)7 (17%)NS
     Mean leukoaraiosis score ± SD5.7 ± 5.06.9 ± 5.2NS
      (range)(0–17)(0–16)
    Physical diseases
     Ischemic heart disease3 (9%)6 (14%)NS
     Cancer3 (9%)6 (14%)NS
     Hypertension10 (35%)18 (41%)NS
     Diabetes mellitus1 (4%)2 (5%)NS
    • * t test for independent samples, or chi-square test.

    • † In control subjects, computed on the basis of the telephone version of the test (26, 27).

    • ‡ Data available for 28 historical control subjects and 41 patients with AD (12, 16).

    • View popup
    TABLE 2:

    Test-Retest and Interrater Reliability Versus Other Linear Measures of MTL Atrophy in 20 Patients with AD and 20 Control Subjects in the CT Group

    Mean Difference Between MeasurementsIntraclass Correlation
    Crude Values (mm) TestCrude (mm)Standardized (z)Coefficient
    1st Rater, Test1st Rater, Retest2nd RaterWithin RaterBetween RatersWithin RaterBetween RatersWithin RaterBetween Raters
    Mean radial width of the temporal horn ± SD
     Right4.6 ± 3.04.4 ± 2.94.5 ± 2.70.21 ± .67−0.20 ± 0.770.07 ± 0.22−0.09 ± 0.250.970.96
     Left4.0 ± 2.83.9 ± 2.74.1 ± 2.70.11 ± .48−0.19 ± 0.650.04 ± 0.17−0.05 ± 0.230.980.95
     Largest5.1 ± 3.04.9 ± 2.85.2 ± 3.00.25 ± .56−0.29 ± 0.810.09 ± 0.19−0.12 ± 0.260.980.94
    Mean transverse widthof the temporal horn ± SD
     Right3.6 ± 1.53.7 ± 1.63.7 ± 1.5−0.09 ± .34−0.05 ± 0.59−0.06 ± 0.23−0.03 ± 0.410.970.93
     Left4.7 ± 2.54.8 ± 2.54.8 ± 2.3−0.14 ± .46−0.16 ± 0.58−0.05 ± 0.18−0.06 ± 0.230.980.97
     Largest5.1 ± 2.45.2 ± 2.25.3 ± 2.3−0.09 ± .42−0.18 ± 0.64−0.04 ± 0.18−0.08 ± 0.270.980.96
    Mean minimum thickness of the MLT ± SD
     Right13.5 ± 3.314.2 ± 3.014.0 ± 4.1−0.71 ± 2.36−0.51 ± 2.47−0.22 ± 0.72−0.16 ± 0.760.710.73
     Left14.1 ± 3.414.3 ± 2.714.4 ± 3.9−0.20 ± 2.43−0.36 ± 2.68−0.06 ± 0.71−0.10 ± 0.780.690.66
     Smallest12.9 ± 3.313.4 ± 2.713.3 ± 4.1−0.43 ± 2.20−0.39 ± 2.42−0.13 ± 0.67−0.12 ± 0.730.740.78
    • Note.—Standardized (z) differences are computed by considering control subjects as the reference group.

    • View popup
    TABLE 3:

    Convergent and Discriminant Validity in 42 Patients with AD and 29 Control Subjects in the CT Group

    Volumetric MeasuresPearson’s r (95% confidence interval), rWTH
    RightLeftLargest
    Transverse width of the temporal hornHL0.74 (0.61–0.83)0.79 (0.68–0.86)0.76 (0.64–0.84)
    CL0.60 (0.43–0.73)0.74 (0.61–0.83)
    Minimum thickness of the medial temporal lobeHL−0.71 (−0.81–0.57)−0.69 (−0.80–−0.54)−0.78 (−0.86–−0.67)
    CL−0.63 (−0.75–−0.47)−0.68 (−0.79–−0.53)
    Interuncal distance0.49 (0.29–0.65)0.50 (0.30–0.66)0.48 (0.28–0.64)
    Frontal indexHL0.42 (0.21–0.60)0.40 (0.18–0.58)0.40 (0.18–0.58)
    CL0.42 (0.21–0.60)0.35 (0.13–0.54)
    • Note.—HL indicates homolateral; CL, contralateral.

    • View popup
    TABLE 4:

    Comparison of Known-Group Validity (Discrimination of 42 Patients with AD from 29 Control Subjects) with Other Linear CT-Based Measures of MTL Lobe Atrophy in CT Group

    Control GroupAD GroupSensitivity (95% CI)*
    Mean Crude Measure ± SD (mm)Mean Crude Measure ± SD (mm)Mean W-score ± SD
    Radial width of the temporal horn
     Right2.9 ± 1.47.8 ± 3.03.6 ± 2.286% (71%–94%)
     Left2.4 ± 1.37.8 ± 3.24.1 ± 2.483% (68%–92%)
     Largest3.2 ± 1.29.1 ± 3.04.7 ± 2.493% (80%–98%)
    Transverse width of the temporal horn
     Right1.0 ± 1.13.7 ± 1.92.2 ± 1.762% (46%–76%)
     Left1.2 ± 1.34.3 ± 2.42.3 ± 1.957% (41%–72%)
     Largest1.5 ± 1.34.7 ± 2.32.4 ± 1.964% (48%–78%)
    Minimum thickness of the medial temporal lobe
     Right17.4 ± 2.310.9 ± 3.4−2.7 ± 1.474% (58%–86%)
     Left17.0 ± 3.111.6 ± 3.6−1.9 ± 1.257% (41%–72%)
     Smallest16.4 ± 2.810.2 ± 3.3−2.4 ± 1.274% (58%–86%)
    • Note.—P < .001 for difference between groups on t test for all measures. W scores are age-standardized values; that is, the number of SD away from the age-specific atrophy value of control subjects (W scores in control subjects, 0.0 ± 1.0). Greater absolute values indicate greater atrophy.

    • * Values computed by modeling W scores of patients with AD and control subjects with specificity set at 95%.

    • View popup
    TABLE 5:

    Baseline Characteristics of the MR Study Group

    Baseline CharacteristicsControl Group (n = 28)AD Group (n = 28)P value*
    Sociodemographics and anthropometrics
     Mean age at observation ± SD (y)69 ± 874 ± 9.05
      (range)(54–83)(53–86)
     Women19 (68%)22 (79%)NS
     Mean education ± SD (y)8 ± 37 ± 4NS
      (range)(5–19)(2–18)
    Dementia-related variables
     MMSE score ± SD29.2 ± 1.520.5 ± 4.2<.0001
      (range)(25–30)(12–27)
     CDR 0/.5/1/2 or 328/0/0/00/8/12/8<.0001
     Mean disease duration ± SD (mo)—42 ± 26—
      (range)(9–120)
     ApoE ε4 allele†6/52 (12%)17/52 (33%).02
    • * t test for independent samples or chi-square test.

    • † Genotyping available for 26 patients with AD and 26 control subjects.

    • View popup
    TABLE 6:

    Convergent and Discriminant Validity in 28 Patients with AD and 28 Control Subjects in MR Group

    Atrophy MeasuresPearson’s r (95% CI), rWTH
    RightLeftLargest
    Linear measures on coronal imagesHL
     Temporal horn0.73 (0.58–0.83)0.74 (0.59–0.84)0.83 (0.73–0.90)
      WidthCL0.78 (0.65–0.87)0.59 (0.39–0.74)
     Choroid fissureHL0.47 (0.24–0.65)0.58 (0.37–0.73)0.53 (0.31–0.70)
      WidthCL0.46 (0.22–0.64)0.41 (0.16–0.61)
     HippocampalHL−0.57 (−0.72–−0.36)−0.46 (−0.64–−0.22)−0.47 (−0.65–−0.24)
      HeightCL−0.48 (−0.66–−0.25)−0.48 (−0.66–−0.25)
     Interuncal distance0.44 (0.20–0.63)0.43 (0.19–0.62)0.40 (0.15–0.60)
     Interhemispheric fissure width0.16 (−0.11–0.41)0.07 (−0.20–0.33)0.15 (−0.12–0.40)
    Semiautomated volumetric measures
     Temporal hornHL0.79 (0.67–0.87)0.77 (0.64–0.86)0.80 (0.68–0.88)
    CL0.79 (0.67–0.87)0.58 (0.37–0.73)
     Temporal lobeHL−0.62 (−0.76–0.43)−0.60 (−0.75–−0.40)−0.68 (0.51–0.80)
    CL−0.65 (−0.78–−0.47)−0.50 (−0.67–−0.27)
     Frontal lobeHL−0.50 (−0.67–−0.27)−0.44 (−0.63–−0.20)−0.49 (0.26–0.67)
    CL−0.54 (−0.70–−0.32)−0.40 (−0.60–−0.15)
    Manually traced volumetric measures
     HippocampusHL−0.69 (−0.81–−0.52)−0.66 (−0.79–−0.48)−0.74 (−0.84–−0.59)
    CL−0.69 (−0.81–−0.52)−0.59 (−0.74–−0.39)
     Entorhinal cortexHL−0.56 (−0.72–−0.35)−0.50 (−0.67–−0.27)−0.58 (−0.73–−0.37)
    CL−0.50 (−0.67–−0.27)−0.52 (−0.69–−0.30)
    • Note.—HL indicates homolateral; CL, contralateral.

    • View popup
    TABLE 7:

    Comparison of Known-Group Validity (Discrimination of 28 Patients with AD from 28 Control Subjects) with Linear and Volumetric MR-Based Measures of MTL Atrophy in the MR Group

    Control GroupAD GroupSensitivity (95% CI)*
    Mean Crude Measure ± SD (mm)Mean Crude Measure ± SD (mm)Mean W-score ± SD
    Radial width of the temporal horn (mm)
     Right3.7 ± 1.16.7 ± 2.03.0 ± 1.976% (56%–89%)
     Left3.3 ± 1.55.8 ± 2.51.7 ± 1.651% (32%–70%)
     Largest4.1 ± 1.27.2 ± 2.12.7 ± 1.773% (53%–87%)
    Coronal width of the temporal horn (mm)
     Right3.0 ± 1.25.3 ± 2.32.4 ± 2.363% (43%–80%)
     Left3.2 ± 1.16.1 ± 2.33.4 ± 2.774% (54%–88%)
     Largest3.4 ± 1.26.5 ± 2.32.7 ± 2.169% (49%–84%)
    Hippocampal volume (mm3)
     Right1951 ± 3351309 ± 3611.7 ± 1.252% (33%–71%)
     Left1797 ± 2881263 ± 3441.7 ± 1.052% (33%–71%)
     Smallest1774 ± 2821191 ± 3362.3 ± 1.271% (51%–86%)
    • Note.—P < .0005 for difference between groups on t test for all measures. W scores are age-standardized values, that is, the number of SD away from the age-specific atrophy value of control subjects (control W scores, 0 ± 1.0). Greater absolute values indicate greater atrophy.

    • * Values computed by modeling W scores of Patients with AD and control subjects with specificity set at 95%.

PreviousNext
Back to top

In this issue

American Journal of Neuroradiology: 23 (1)
American Journal of Neuroradiology
Vol. 23, Issue 1
1 Jan 2002
  • Table of Contents
  • Index by author
Advertisement
Print
Download PDF
Email Article

Thank you for your interest in spreading the word on American Journal of Neuroradiology.

NOTE: We only request your email address so that the person you are recommending the page to knows that you wanted them to see it, and that it is not junk mail. We do not capture any email address.

Enter multiple addresses on separate lines or separate them with commas.
Radial Width of the Temporal Horn: A Sensitive Measure in Alzheimer Disease
(Your Name) has sent you a message from American Journal of Neuroradiology
(Your Name) thought you would like to see the American Journal of Neuroradiology web site.
CAPTCHA
This question is for testing whether or not you are a human visitor and to prevent automated spam submissions.
Cite this article
Giovanni B. Frisoni, Cristina Geroldi, Alberto Beltramello, Angelo Bianchetti, Giuliano Binetti, Giovanni Bordiga, Charles DeCarli, Mikko P. Laakso, Hilkka Soininen, Cristina Testa, Orazio Zanetti, Marco Trabucchi
Radial Width of the Temporal Horn: A Sensitive Measure in Alzheimer Disease
American Journal of Neuroradiology Jan 2002, 23 (1) 35-47;

Citation Manager Formats

  • BibTeX
  • Bookends
  • EasyBib
  • EndNote (tagged)
  • EndNote 8 (xml)
  • Medlars
  • Mendeley
  • Papers
  • RefWorks Tagged
  • Ref Manager
  • RIS
  • Zotero
0 Responses
Respond to this article
Share
Bookmark this article
Radial Width of the Temporal Horn: A Sensitive Measure in Alzheimer Disease
Giovanni B. Frisoni, Cristina Geroldi, Alberto Beltramello, Angelo Bianchetti, Giuliano Binetti, Giovanni Bordiga, Charles DeCarli, Mikko P. Laakso, Hilkka Soininen, Cristina Testa, Orazio Zanetti, Marco Trabucchi
American Journal of Neuroradiology Jan 2002, 23 (1) 35-47;
del.icio.us logo Twitter logo Facebook logo Mendeley logo
  • Tweet Widget
  • Facebook Like
  • Google Plus One

Jump to section

  • Article
    • Abstract
    • Methods
    • Results
    • Discussion
    • Acknowledgments
    • Footnotes
    • References
  • Figures & Data
  • Info & Metrics
  • Responses
  • References
  • PDF

Related Articles

  • No related articles found.
  • PubMed
  • Google Scholar

Cited By...

  • Dysgraphic features in motor neuron disease: a review
  • National Institute of Neurological Disorders and Stroke-Canadian Stroke Network Vascular Cognitive Impairment Harmonization Standards
  • The Magic Measurement
  • Neuroimaging tools to rate regional atrophy, subcortical cerebrovascular disease, and regional cerebral blood flow and metabolism: consensus paper of the EADC
  • Crossref
  • Google Scholar

This article has not yet been cited by articles in journals that are participating in Crossref Cited-by Linking.

More in this TOC Section

  • Optimal MRI Sequence for Identifying Occlusion Location in Acute Stroke: Which Value of Time-Resolved Contrast-Enhanced MRA?
  • Evaluating the Effects of White Matter Multiple Sclerosis Lesions on the Volume Estimation of 6 Brain Tissue Segmentation Methods
  • Quiet PROPELLER MRI Techniques Match the Quality of Conventional PROPELLER Brain Imaging Techniques
Show more Brain

Similar Articles

Advertisement

Indexed Content

  • Current Issue
  • Accepted Manuscripts
  • Article Preview
  • Past Issues
  • Editorials
  • Editor's Choice
  • Fellows' Journal Club
  • Letters to the Editor
  • Video Articles

Cases

  • Case Collection
  • Archive - Case of the Week
  • Archive - Case of the Month
  • Archive - Classic Case

More from AJNR

  • Trainee Corner
  • Imaging Protocols
  • MRI Safety Corner
  • Book Reviews

Multimedia

  • AJNR Podcasts
  • AJNR Scantastics

Resources

  • Turnaround Time
  • Submit a Manuscript
  • Submit a Video Article
  • Submit an eLetter to the Editor/Response
  • Manuscript Submission Guidelines
  • Statistical Tips
  • Fast Publishing of Accepted Manuscripts
  • Graphical Abstract Preparation
  • Imaging Protocol Submission
  • Evidence-Based Medicine Level Guide
  • Publishing Checklists
  • Author Policies
  • Become a Reviewer/Academy of Reviewers
  • News and Updates

About Us

  • About AJNR
  • Editorial Board
  • Editorial Board Alumni
  • Alerts
  • Permissions
  • Not an AJNR Subscriber? Join Now
  • Advertise with Us
  • Librarian Resources
  • Feedback
  • Terms and Conditions
  • AJNR Editorial Board Alumni

American Society of Neuroradiology

  • Not an ASNR Member? Join Now

© 2025 by the American Society of Neuroradiology All rights, including for text and data mining, AI training, and similar technologies, are reserved.
Print ISSN: 0195-6108 Online ISSN: 1936-959X

Powered by HighWire